5.2 KiB
heapster
Heapster 监控整个集群资源的过程:首先kubelet内置的cAdvisor收集本node节点的容器资源占用情况,然后heapster从kubelet提供的api采集节点和容器的资源占用,最后heapster 持久化数据存储到influxdb中(也可以是其他的存储后端,Google Cloud Monitoring等)。
Grafana 则通过配置数据源指向上述 influxdb,从而界面化显示监控信息。
部署
访问 heapster release页面下载最新 release 1.4.3,参考目录heapster-1.3.0/deploy/kube-config/influxdb,因为这个官方release 在k8s1.8.4使用还是有不少问题,请在参考的基础上使用本项目提供的yaml文件
安装比较简单 kubectl create -f /etc/ansible/manifests/heapster/,主要讲一下注意事项
grafana.yaml配置
- 修改
heapster-grafana-amd64镜像,v4.2.0版本修改成 v4.4.3版本,否则 grafana pod无法起来,报CrashLoopBackOff错误,详见ISSUE - 参数
- name: GF_SERVER_ROOT_URL的设置要根据后续访问grafana的方式确定,如果使用 NodePort方式访问,必须设置成:value: /;如果使用apiserver proxy方式,必须设置成value: /api/v1/namespaces/kube-system/services/monitoring-grafana/proxy/,注意官方文件中预设的value: /api/v1/proxy/namespaces/kube-system/services/monitoring-grafana/已经不适合k8s 1.8.0版本了, kubernetes.io/cluster-service: 'true'和type: NodePort根据上述的访问方式设置,建议使用apiserver 方式,可以增加安全控制
heapster.yaml配置
- 需要配置 RBAC 把 ServiceAccount
heapster与集群预定义的集群角色system:heapster绑定,这样heapster pod才有相应权限去访问 apiserver
influxdb.yaml配置
- influxdb 官方建议使用命令行或 HTTP API 接口来查询数据库,从 v1.1.0 版本开始默认关闭 admin UI,这里参考opsnull给出的方法,增加ConfigMap配置,然后挂载到容器中,覆盖默认配置
- 注意influxdb 这个版本只能使用 NodePort方式访问它的admin UI,才能正确连接数据库
验证
$ kubectl get pods -n kube-system | grep -E 'heapster|monitoring'
heapster-3273315324-tmxbg               1/1       Running   0          11m
monitoring-grafana-2255110352-94lpn     1/1       Running   0          11m
monitoring-influxdb-884893134-3vb6n     1/1       Running   0          11m
扩展检查Pods日志:
$ kubectl logs heapster-3273315324-tmxbg -n kube-system
$ kubectl logs monitoring-grafana-2255110352-94lpn -n kube-system
$ kubectl logs monitoring-influxdb-884893134-3vb6n -n kube-system
部署完heapster,使用上一步介绍方法查看kubernets dashboard 界面,就可以看到各 Nodes、Pods 的 CPU、内存、负载等利用率曲线图,如果 dashboard上还无法看到利用率图,使用以下命令重启 dashboard pod:
- 首先删除
kubectl scale deploy kubernetes-dashboard --replicas=0 -n kube-system - 然后新建
kubectl scale deploy kubernetes-dashboard --replicas=1 -n kube-system
访问 grafana
1.通过apiserver 访问(建议的方式)
kubectl cluster-info | grep grafana
monitoring-grafana is running at https://x.x.x.x:6443/api/v1/namespaces/kube-system/services/monitoring-grafana/proxy
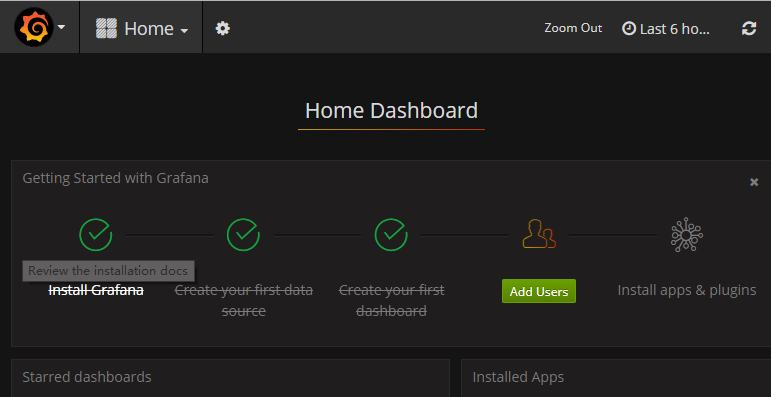
请参考上一步 访问dashboard同样的方式,使用证书或者密码认证(参照hosts文件配置,默认:用户admin 密码test1234),访问https://x.x.x.x:6443/api/v1/namespaces/kube-system/services/monitoring-grafana/proxy即可,如图可以点击[Home]选择查看 Cluster Pods的监控图形
2.通过NodePort 访问
- 修改
Service允许 type: NodePort - 修改
Deployment中参数- name: GF_SERVER_ROOT_URL为value: / - 如果之前grafana已经运行,使用
kubectl replace --force -f /etc/ansible/manifests/heapster/grafana.yaml重启 grafana插件
kubectl get svc -n kube-system|grep grafana
monitoring-grafana        NodePort    10.68.135.50    <none>        80:5855/TCP		11m
然后用浏览器访问 http://NodeIP:5855
访问 influxdb
官方建议使用命令行或 HTTP API 接口来查询influxdb数据库,如非必要就跳过此步骤
目前根据测试 k8s v1.8.4 使用 NodePort 方式访问 admin 界面后才能正常连接数据库
kubectl get svc -n kube-system|grep influxdb
monitoring-influxdb    NodePort    10.68.195.193   <none>        8086:3382/TCP,8083:7651/TCP   12h
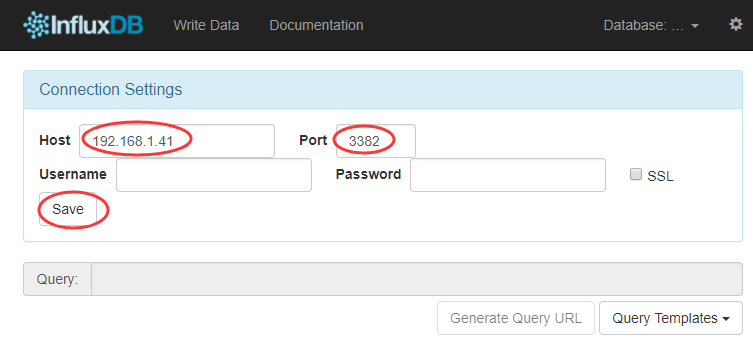
- 如上例子,8083是管理页面端口,对外暴露的端口为7651
- 8086 是数据连接端口,对外暴露的端口为3382
使用浏览器访问 http://NodeIP:7651,如图在页面的 “Connection Settings” 的 Host 中输入 node IP, Port 中输入 3382(由8086对外暴露的端口),点击 “Save” 即可