14 KiB
Kubernetes 网络和集群性能测试
本节将通过构建一个 Kubernetes 测试环境,来测试其网络和集群性能。
准备
测试环境
在以下几种环境下进行测试:
- Kubernetes 集群 node 节点上通过 Cluster IP 方式访问
- Kubernetes 集群内部通过 service 访问
- Kubernetes 集群外部通过 traefik ingress 暴露的地址访问
测试地址
Cluster IP: 10.254.149.31
Service Port:8000
Ingress Host:traefik.sample-webapp.io
测试工具
- Locust:一个简单易用的用户负载测试工具,用来测试 web 或其他系统能够同时处理的并发用户数。
- curl
- kubemark
- 测试程序:sample-webapp,源码见 Github kubernetes 的分布式负载测试
测试说明
通过向 sample-webapp 发送 curl 请求获取响应时间,直接 curl 后的结果为:
$ curl "http://10.254.149.31:8000/"
Welcome to the "Distributed Load Testing Using Kubernetes" sample web app
网络延迟测试
场景一、 Kubernetes 集群 node 节点上通过 Cluster IP 访问
测试命令
curl -o /dev/null -s -w '%{time_connect} %{time_starttransfer} %{time_total}' "http://10.254.149.31:8000/"
10 组测试结果
| No | time_connect | time_starttransfer | time_total |
|---|---|---|---|
| 1 | 0.000 | 0.003 | 0.003 |
| 2 | 0.000 | 0.002 | 0.002 |
| 3 | 0.000 | 0.002 | 0.002 |
| 4 | 0.000 | 0.002 | 0.002 |
| 5 | 0.000 | 0.002 | 0.002 |
| 6 | 0.000 | 0.002 | 0.002 |
| 7 | 0.000 | 0.002 | 0.002 |
| 8 | 0.000 | 0.002 | 0.002 |
| 9 | 0.000 | 0.002 | 0.002 |
| 10 | 0.000 | 0.002 | 0.002 |
平均响应时间:2ms
时间指标说明
单位:秒
time_connect:建立到服务器的 TCP 连接所用的时间
time_starttransfer:在发出请求之后,Web 服务器返回数据的第一个字节所用的时间
time_total:完成请求所用的时间
场景二、Kubernetes 集群内部通过 service 访问
测试命令
curl -o /dev/null -s -w '%{time_connect} %{time_starttransfer} %{time_total}' "http://sample-webapp:8000/"
10 组测试结果
| No | time_connect | time_starttransfer | time_total |
|---|---|---|---|
| 1 | 0.004 | 0.006 | 0.006 |
| 2 | 0.004 | 0.006 | 0.006 |
| 3 | 0.004 | 0.006 | 0.006 |
| 4 | 0.004 | 0.006 | 0.006 |
| 5 | 0.004 | 0.006 | 0.006 |
| 6 | 0.004 | 0.006 | 0.006 |
| 7 | 0.004 | 0.006 | 0.006 |
| 8 | 0.004 | 0.006 | 0.006 |
| 9 | 0.004 | 0.006 | 0.006 |
| 10 | 0.004 | 0.006 | 0.006 |
平均响应时间:6ms
场景三、在公网上通过 traefik ingress 访问
测试命令
curl -o /dev/null -s -w '%{time_connect} %{time_starttransfer} %{time_total}' "http://traefik.sample-webapp.io" >>result
10 组测试结果
| No | time_connect | time_starttransfer | time_total |
|---|---|---|---|
| 1 | 0.043 | 0.085 | 0.085 |
| 2 | 0.052 | 0.093 | 0.093 |
| 3 | 0.043 | 0.082 | 0.082 |
| 4 | 0.051 | 0.093 | 0.093 |
| 5 | 0.068 | 0.188 | 0.188 |
| 6 | 0.049 | 0.089 | 0.089 |
| 7 | 0.051 | 0.113 | 0.113 |
| 8 | 0.055 | 0.120 | 0.120 |
| 9 | 0.065 | 0.126 | 0.127 |
| 10 | 0.050 | 0.111 | 0.111 |
平均响应时间:110ms
测试结果
在这三种场景下的响应时间测试结果如下:
- Kubernetes 集群 node 节点上通过 Cluster IP 方式访问:2ms
- Kubernetes 集群内部通过 service 访问:6ms
- Kubernetes 集群外部通过 traefik ingress 暴露的地址访问:110ms
注意:执行测试的 node 节点 / Pod 与 serivce 所在的 pod 的距离(是否在同一台主机上),对前两个场景可以能会有一定影响。
网络性能测试
网络使用 flannel 的 vxlan 模式。
使用 iperf 进行测试。
服务端命令:
iperf -s -p 12345 -i 1 -M
客户端命令:
iperf -c ${server-ip} -p 12345 -i 1 -t 10 -w 20K
场景一、主机之间
[ ID] Interval       Transfer     Bandwidth
[  3]  0.0- 1.0 sec   598 MBytes  5.02 Gbits/sec
[  3]  1.0- 2.0 sec   637 MBytes  5.35 Gbits/sec
[  3]  2.0- 3.0 sec   664 MBytes  5.57 Gbits/sec
[  3]  3.0- 4.0 sec   657 MBytes  5.51 Gbits/sec
[  3]  4.0- 5.0 sec   641 MBytes  5.38 Gbits/sec
[  3]  5.0- 6.0 sec   639 MBytes  5.36 Gbits/sec
[  3]  6.0- 7.0 sec   628 MBytes  5.26 Gbits/sec
[  3]  7.0- 8.0 sec   649 MBytes  5.44 Gbits/sec
[  3]  8.0- 9.0 sec   638 MBytes  5.35 Gbits/sec
[  3]  9.0-10.0 sec   652 MBytes  5.47 Gbits/sec
[  3]  0.0-10.0 sec  6.25 GBytes  5.37 Gbits/sec
场景二、不同主机的 Pod 之间 (使用 flannel 的 vxlan 模式)
[ ID] Interval       Transfer     Bandwidth
[  3]  0.0- 1.0 sec   372 MBytes  3.12 Gbits/sec
[  3]  1.0- 2.0 sec   345 MBytes  2.89 Gbits/sec
[  3]  2.0- 3.0 sec   361 MBytes  3.03 Gbits/sec
[  3]  3.0- 4.0 sec   397 MBytes  3.33 Gbits/sec
[  3]  4.0- 5.0 sec   405 MBytes  3.40 Gbits/sec
[  3]  5.0- 6.0 sec   410 MBytes  3.44 Gbits/sec
[  3]  6.0- 7.0 sec   404 MBytes  3.39 Gbits/sec
[  3]  7.0- 8.0 sec   408 MBytes  3.42 Gbits/sec
[  3]  8.0- 9.0 sec   451 MBytes  3.78 Gbits/sec
[  3]  9.0-10.0 sec   387 MBytes  3.25 Gbits/sec
[  3]  0.0-10.0 sec  3.85 GBytes  3.30 Gbits/sec
场景三、Node 与非同主机的 Pod 之间(使用 flannel 的 vxlan 模式)
[ ID] Interval       Transfer     Bandwidth
[  3]  0.0- 1.0 sec   372 MBytes  3.12 Gbits/sec
[  3]  1.0- 2.0 sec   420 MBytes  3.53 Gbits/sec
[  3]  2.0- 3.0 sec   434 MBytes  3.64 Gbits/sec
[  3]  3.0- 4.0 sec   409 MBytes  3.43 Gbits/sec
[  3]  4.0- 5.0 sec   382 MBytes  3.21 Gbits/sec
[  3]  5.0- 6.0 sec   408 MBytes  3.42 Gbits/sec
[  3]  6.0- 7.0 sec   403 MBytes  3.38 Gbits/sec
[  3]  7.0- 8.0 sec   423 MBytes  3.55 Gbits/sec
[  3]  8.0- 9.0 sec   376 MBytes  3.15 Gbits/sec
[  3]  9.0-10.0 sec   451 MBytes  3.78 Gbits/sec
[  3]  0.0-10.0 sec  3.98 GBytes  3.42 Gbits/sec
场景四、不同主机的 Pod 之间(使用 flannel 的 host-gw 模式)
[ ID] Interval       Transfer     Bandwidth
[  5]  0.0- 1.0 sec   530 MBytes  4.45 Gbits/sec
[  5]  1.0- 2.0 sec   576 MBytes  4.84 Gbits/sec
[  5]  2.0- 3.0 sec   631 MBytes  5.29 Gbits/sec
[  5]  3.0- 4.0 sec   580 MBytes  4.87 Gbits/sec
[  5]  4.0- 5.0 sec   627 MBytes  5.26 Gbits/sec
[  5]  5.0- 6.0 sec   578 MBytes  4.85 Gbits/sec
[  5]  6.0- 7.0 sec   584 MBytes  4.90 Gbits/sec
[  5]  7.0- 8.0 sec   571 MBytes  4.79 Gbits/sec
[  5]  8.0- 9.0 sec   564 MBytes  4.73 Gbits/sec
[  5]  9.0-10.0 sec   572 MBytes  4.80 Gbits/sec
[  5]  0.0-10.0 sec  5.68 GBytes  4.88 Gbits/sec
场景五、Node 与非同主机的 Pod 之间(使用 flannel 的 host-gw 模式)
[ ID] Interval       Transfer     Bandwidth
[  3]  0.0- 1.0 sec   570 MBytes  4.78 Gbits/sec
[  3]  1.0- 2.0 sec   552 MBytes  4.63 Gbits/sec
[  3]  2.0- 3.0 sec   598 MBytes  5.02 Gbits/sec
[  3]  3.0- 4.0 sec   580 MBytes  4.87 Gbits/sec
[  3]  4.0- 5.0 sec   590 MBytes  4.95 Gbits/sec
[  3]  5.0- 6.0 sec   594 MBytes  4.98 Gbits/sec
[  3]  6.0- 7.0 sec   598 MBytes  5.02 Gbits/sec
[  3]  7.0- 8.0 sec   606 MBytes  5.08 Gbits/sec
[  3]  8.0- 9.0 sec   596 MBytes  5.00 Gbits/sec
[  3]  9.0-10.0 sec   604 MBytes  5.07 Gbits/sec
[  3]  0.0-10.0 sec  5.75 GBytes  4.94 Gbits/sec
网络性能对比综述
使用 Flannel 的 vxlan 模式实现每个 pod 一个 IP 的方式,会比宿主机直接互联的网络性能损耗 30%~40%,符合网上流传的测试结论。而 flannel 的 host-gw 模式比起宿主机互连的网络性能损耗大约是 10%。
Vxlan 会有一个封包解包的过程,所以会对网络性能造成较大的损耗,而 host-gw 模式是直接使用路由信息,网络损耗小。
Kubernete的性能测试
Kubernete 的性能测试
参考 Kubernetes 集群性能测试中的步骤,对 kubernetes 的性能进行测试。
我的集群版本是 Kubernetes1.6.0,首先克隆代码,将 kubernetes 目录复制到 $GOPATH/src/k8s.io/ 下然后执行:
$ ./hack/generate-bindata.sh
/usr/local/src/k8s.io/kubernetes /usr/local/src/k8s.io/kubernetes
Generated bindata file : test/e2e/generated/bindata.go has 13498 test/e2e/generated/bindata.go lines of lovely automated artifacts
No changes in generated bindata file: pkg/generated/bindata.go
/usr/local/src/k8s.io/kubernetes
$ make WHAT="test/e2e/e2e.test"
...
+++ [0425 17:01:34] Generating bindata:
    test/e2e/generated/gobindata_util.go
/usr/local/src/k8s.io/kubernetes /usr/local/src/k8s.io/kubernetes/test/e2e/generated
/usr/local/src/k8s.io/kubernetes/test/e2e/generated
+++ [0425 17:01:34] Building go targets for linux/amd64:
    test/e2e/e2e.test
$ make ginkgo
+++ [0425 17:05:57] Building the toolchain targets:
    k8s.io/kubernetes/hack/cmd/teststale
    k8s.io/kubernetes/vendor/github.com/jteeuwen/go-bindata/go-bindata
+++ [0425 17:05:57] Generating bindata:
    test/e2e/generated/gobindata_util.go
/usr/local/src/k8s.io/kubernetes /usr/local/src/k8s.io/kubernetes/test/e2e/generated
/usr/local/src/k8s.io/kubernetes/test/e2e/generated
+++ [0425 17:05:58] Building go targets for linux/amd64:
    vendor/github.com/onsi/ginkgo/ginkgo

$ export KUBERNETES_PROVIDER=local
$ export KUBECTL_PATH=/usr/bin/kubectl
$ go run hack/e2e.go -v -test  --test_args="--host=http://172.20.0.113:8080 --ginkgo.focus=\[Feature:Performance\]" >>log.txt
测试结果
Apr 25 18:27:31.461: INFO: API calls latencies: {
  "apicalls": [
    {
      "resource": "pods",
      "verb": "POST",
      "latency": {
        "Perc50": 2148000,
        "Perc90": 13772000,
        "Perc99": 14436000,
        "Perc100": 0
      }
    },
    {
      "resource": "services",
      "verb": "DELETE",
      "latency": {
        "Perc50": 9843000,
        "Perc90": 11226000,
        "Perc99": 12391000,
        "Perc100": 0
      }
    },
    ...
Apr 25 18:27:31.461: INFO: [Result:Performance] {
  "version": "v1",
  "dataItems": [
    {
      "data": {
        "Perc50": 2.148,
        "Perc90": 13.772,
        "Perc99": 14.436
      },
      "unit": "ms",
      "labels": {
        "Resource": "pods",
        "Verb": "POST"
      }
    },
...
2.857: INFO: Running AfterSuite actions on all node
Apr 26 10:35:32.857: INFO: Running AfterSuite actions on node 1

Ran 2 of 606 Specs in 268.371 seconds
SUCCESS! -- 2 Passed | 0 Failed | 0 Pending | 604 Skipped PASS

Ginkgo ran 1 suite in 4m28.667870101s
Test Suite Passed
从 kubemark 输出的日志中可以看到 API calls latencies 和 Performance。
日志里显示,创建 90 个 pod 用时 40 秒以内,平均创建每个 pod 耗时 0.44 秒。
不同 type 的资源类型 API 请求耗时分布
| Resource | Verb | 50% | 90% | 99% |
|---|---|---|---|---|
| services | DELETE | 8.472ms | 9.841ms | 38.226ms |
| endpoints | PUT | 1.641ms | 3.161ms | 30.715ms |
| endpoints | GET | 931µs | 10.412ms | 27.97ms |
| nodes | PATCH | 4.245ms | 11.117ms | 18.63ms |
| pods | PUT | 2.193ms | 2.619ms | 17.285ms |
从 log.txt 日志中还可以看到更多详细请求的测试指标。
注意事项
注意事项
测试过程中需要用到 docker 镜像存储在 GCE 中,需要翻墙下载,我没看到哪里配置这个镜像的地址。该镜像副本已上传时速云:
用到的镜像有如下两个:
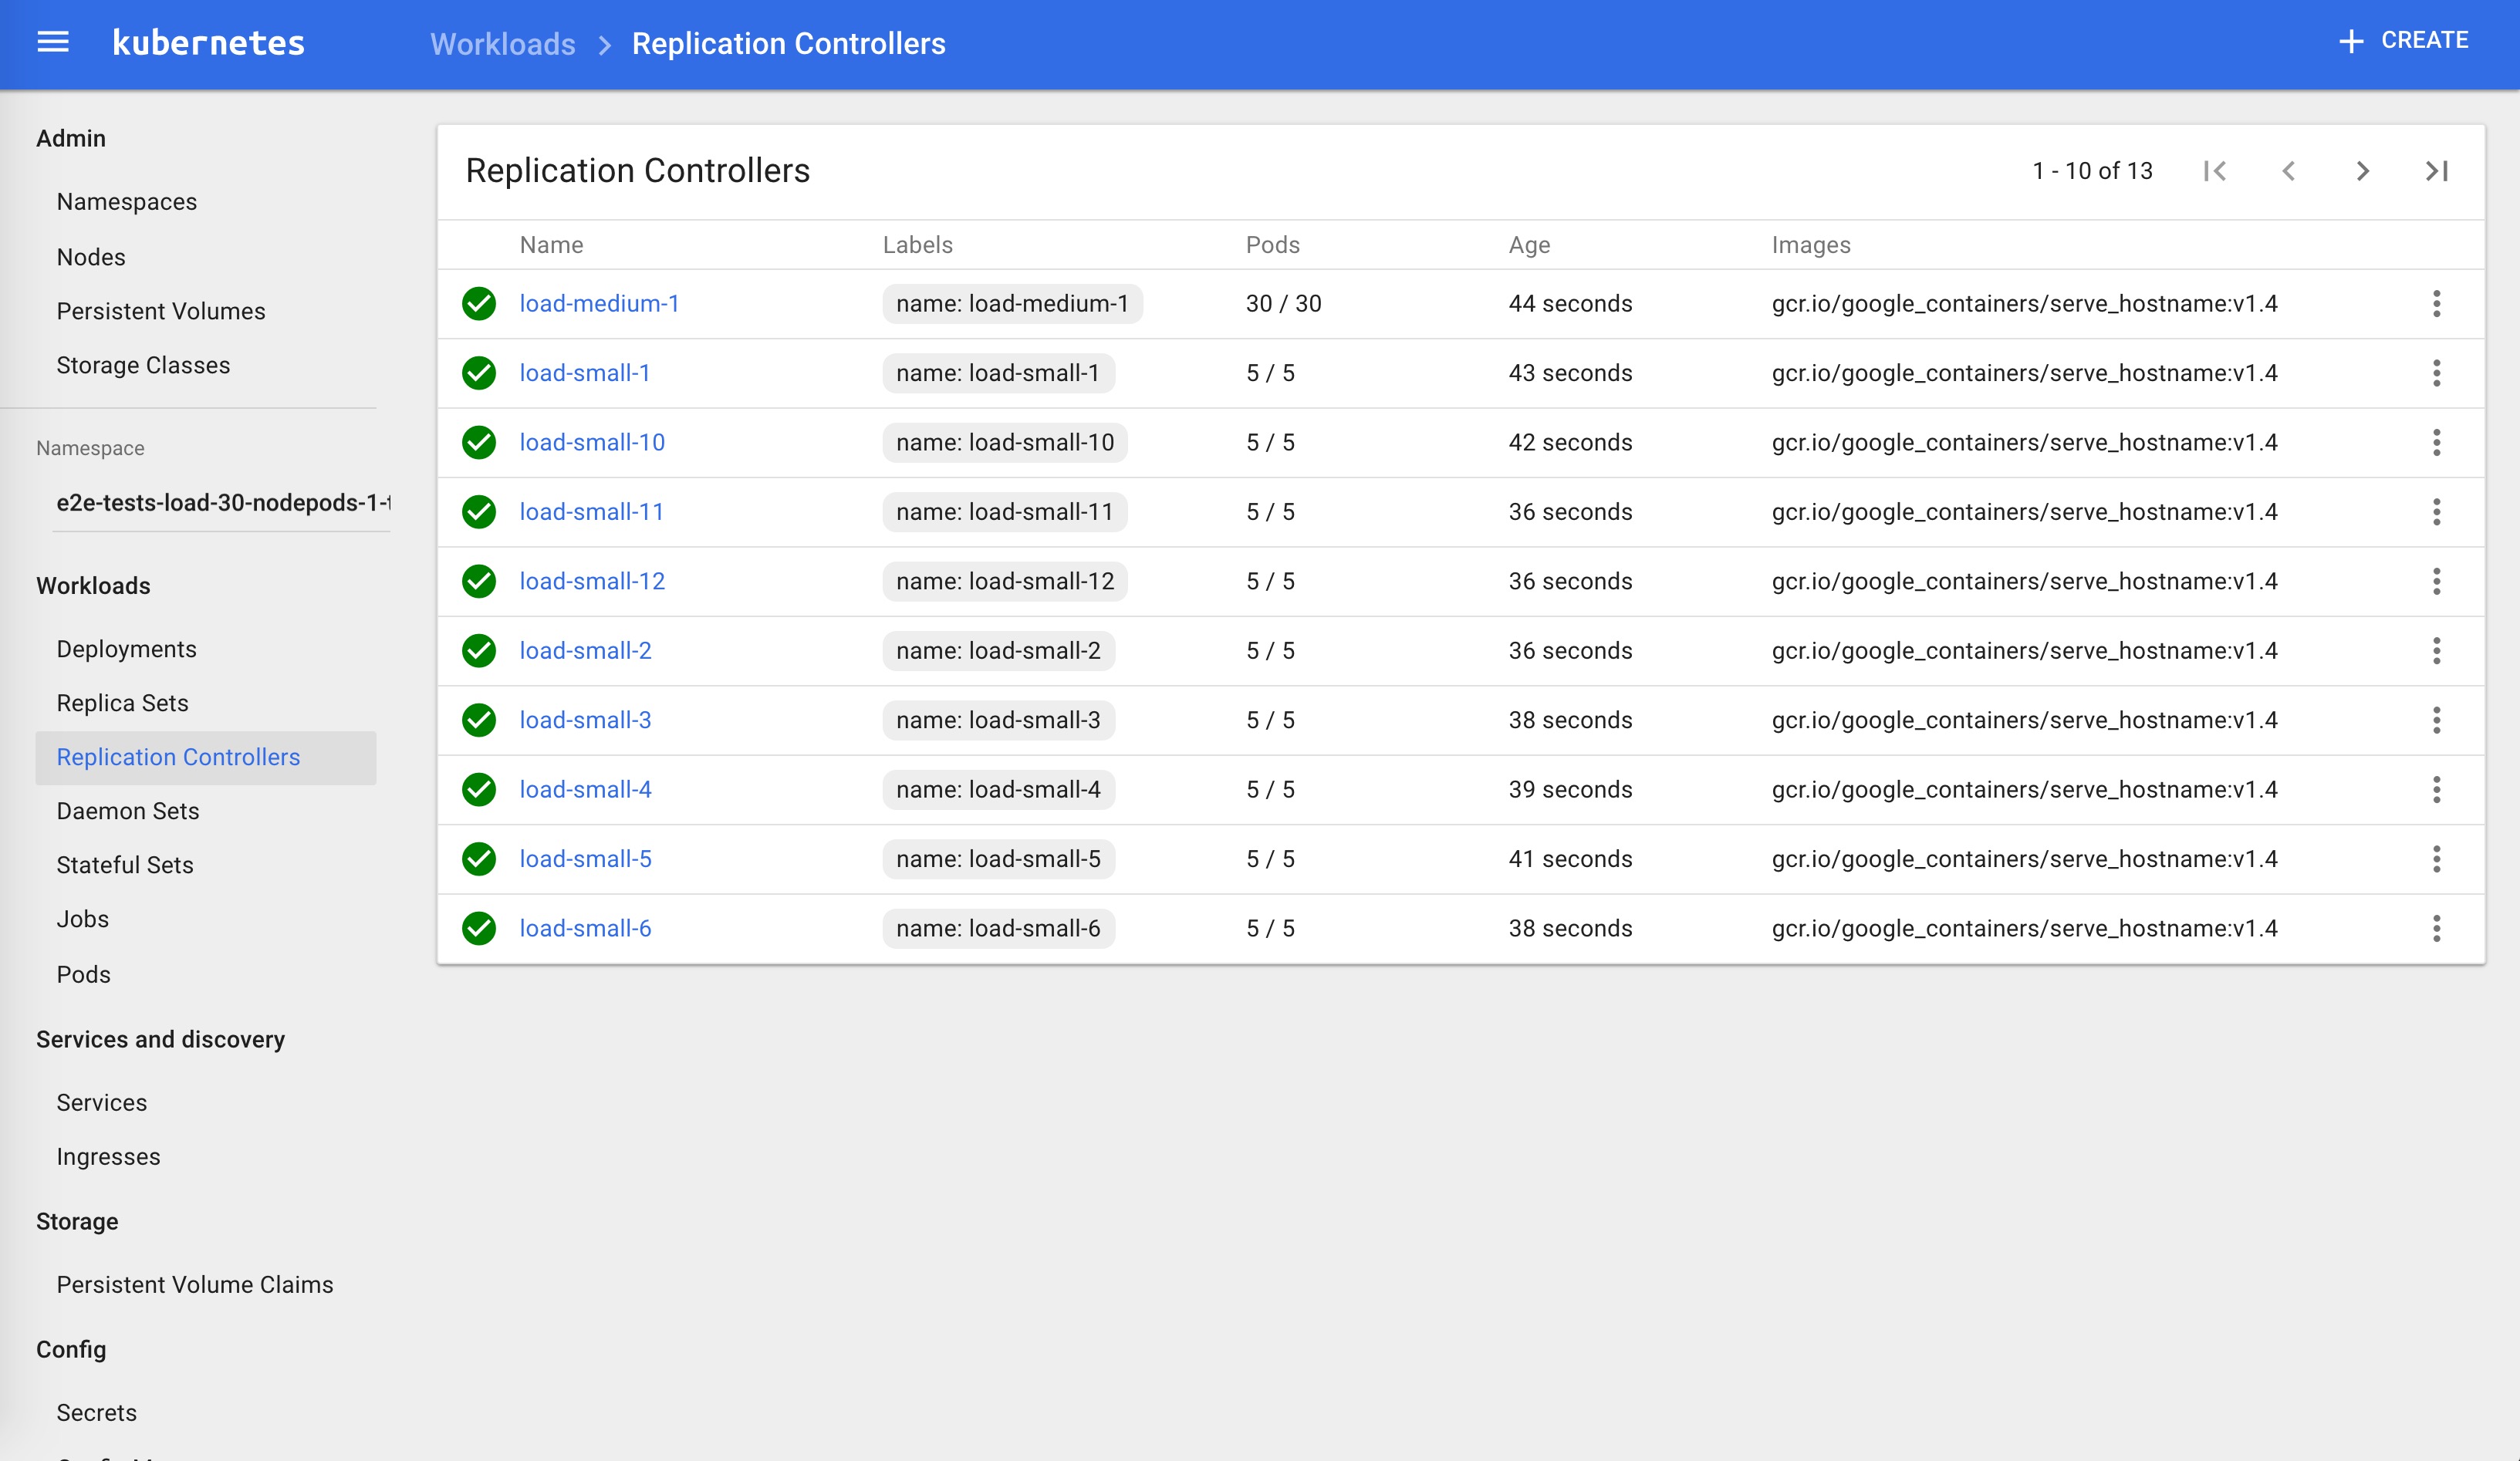
- gcr.io/google_containers/pause-amd64:3.0
- gcr.io/google_containers/serve_hostname:v1.4
Locust 测试
请求统计
| Method | Name | # requests | # failures | Median response time | Average response time | Min response time | Max response time | Average Content Size | Requests/s |
|---|---|---|---|---|---|---|---|---|---|
| POST | /login | 5070 | 78 | 59000 | 80551 | 11218 | 202140 | 54 | 1.17 |
| POST | /metrics | 5114232 | 85879 | 63000 | 82280 | 29518 | 331330 | 94 | 1178.77 |
| None | Total | 5119302 | 85957 | 63000 | 82279 | 11218 | 331330 | 94 | 1179.94 |
响应时间分布
| Name | # requests | 50% | 66% | 75% | 80% | 90% | 95% | 98% | 99% | 100% |
|---|---|---|---|---|---|---|---|---|---|---|
| POST /login | 5070 | 59000 | 125000 | 140000 | 148000 | 160000 | 166000 | 174000 | 176000 | 202140 |
| POST /metrics | 5114993 | 63000 | 127000 | 142000 | 149000 | 160000 | 166000 | 172000 | 176000 | 331330 |
| None Total | 5120063 | 63000 | 127000 | 142000 | 149000 | 160000 | 166000 | 172000 | 176000 | 331330 |
以上两个表格都是瞬时值。请求失败率在 2% 左右。
Sample-webapp 起了 48 个 pod。
Locust 模拟 10 万用户,每秒增长 100 个。
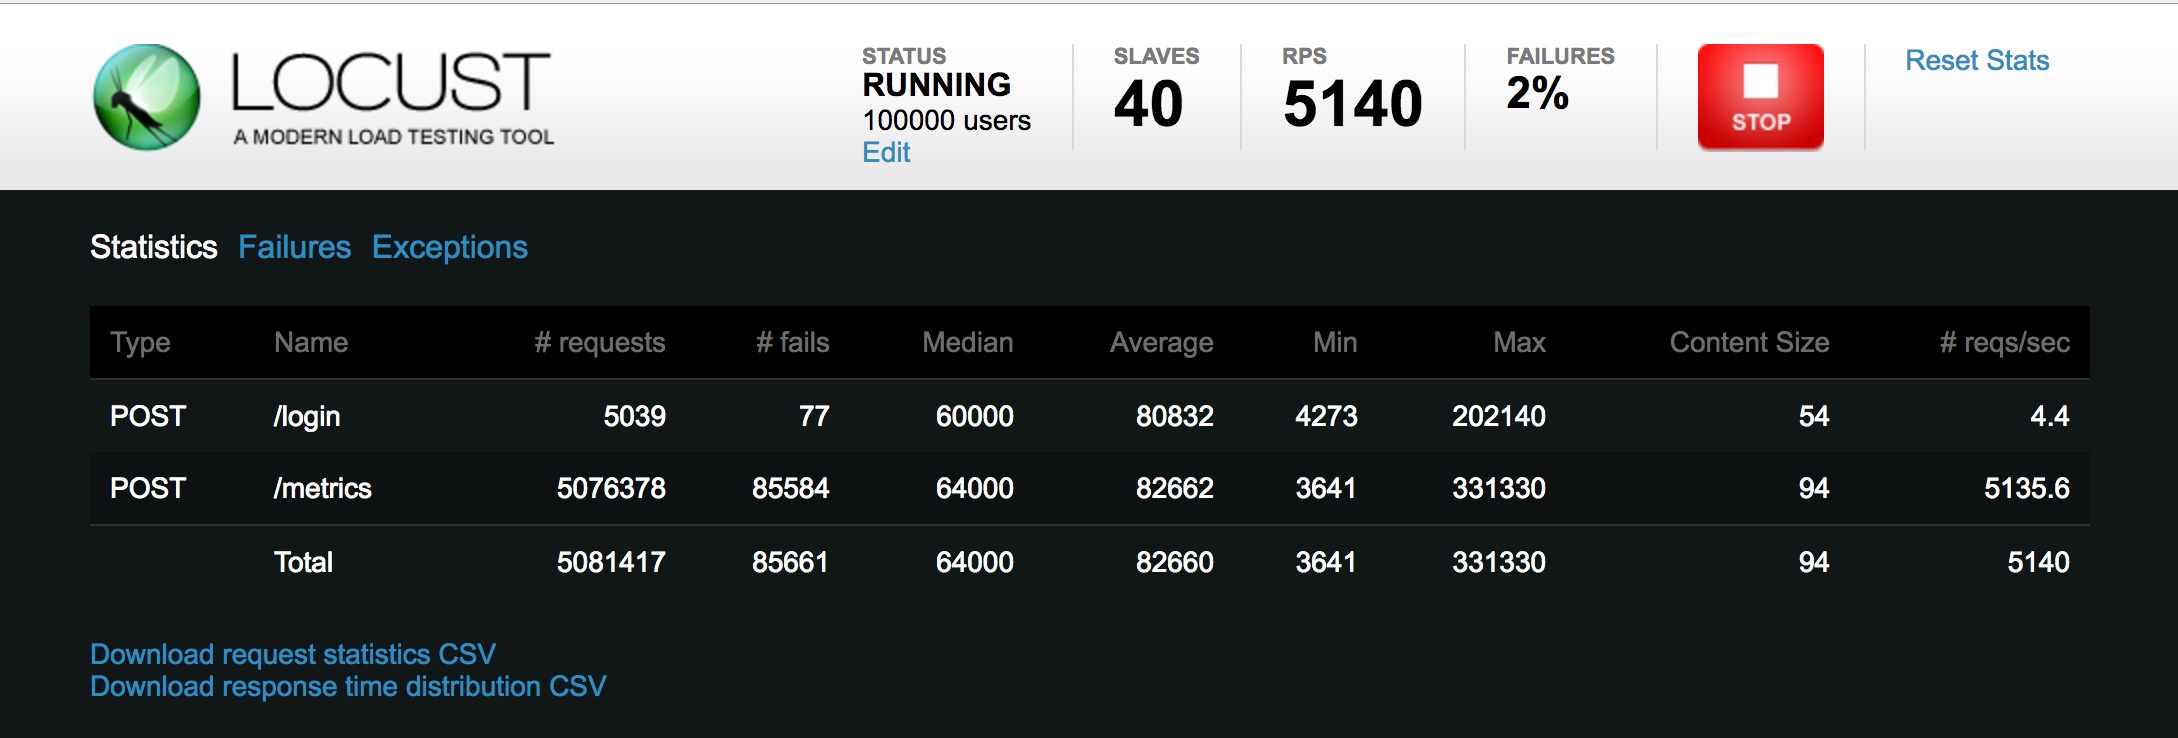
关于 Locust 的使用请参考 Github。