57 KiB
57 KiB
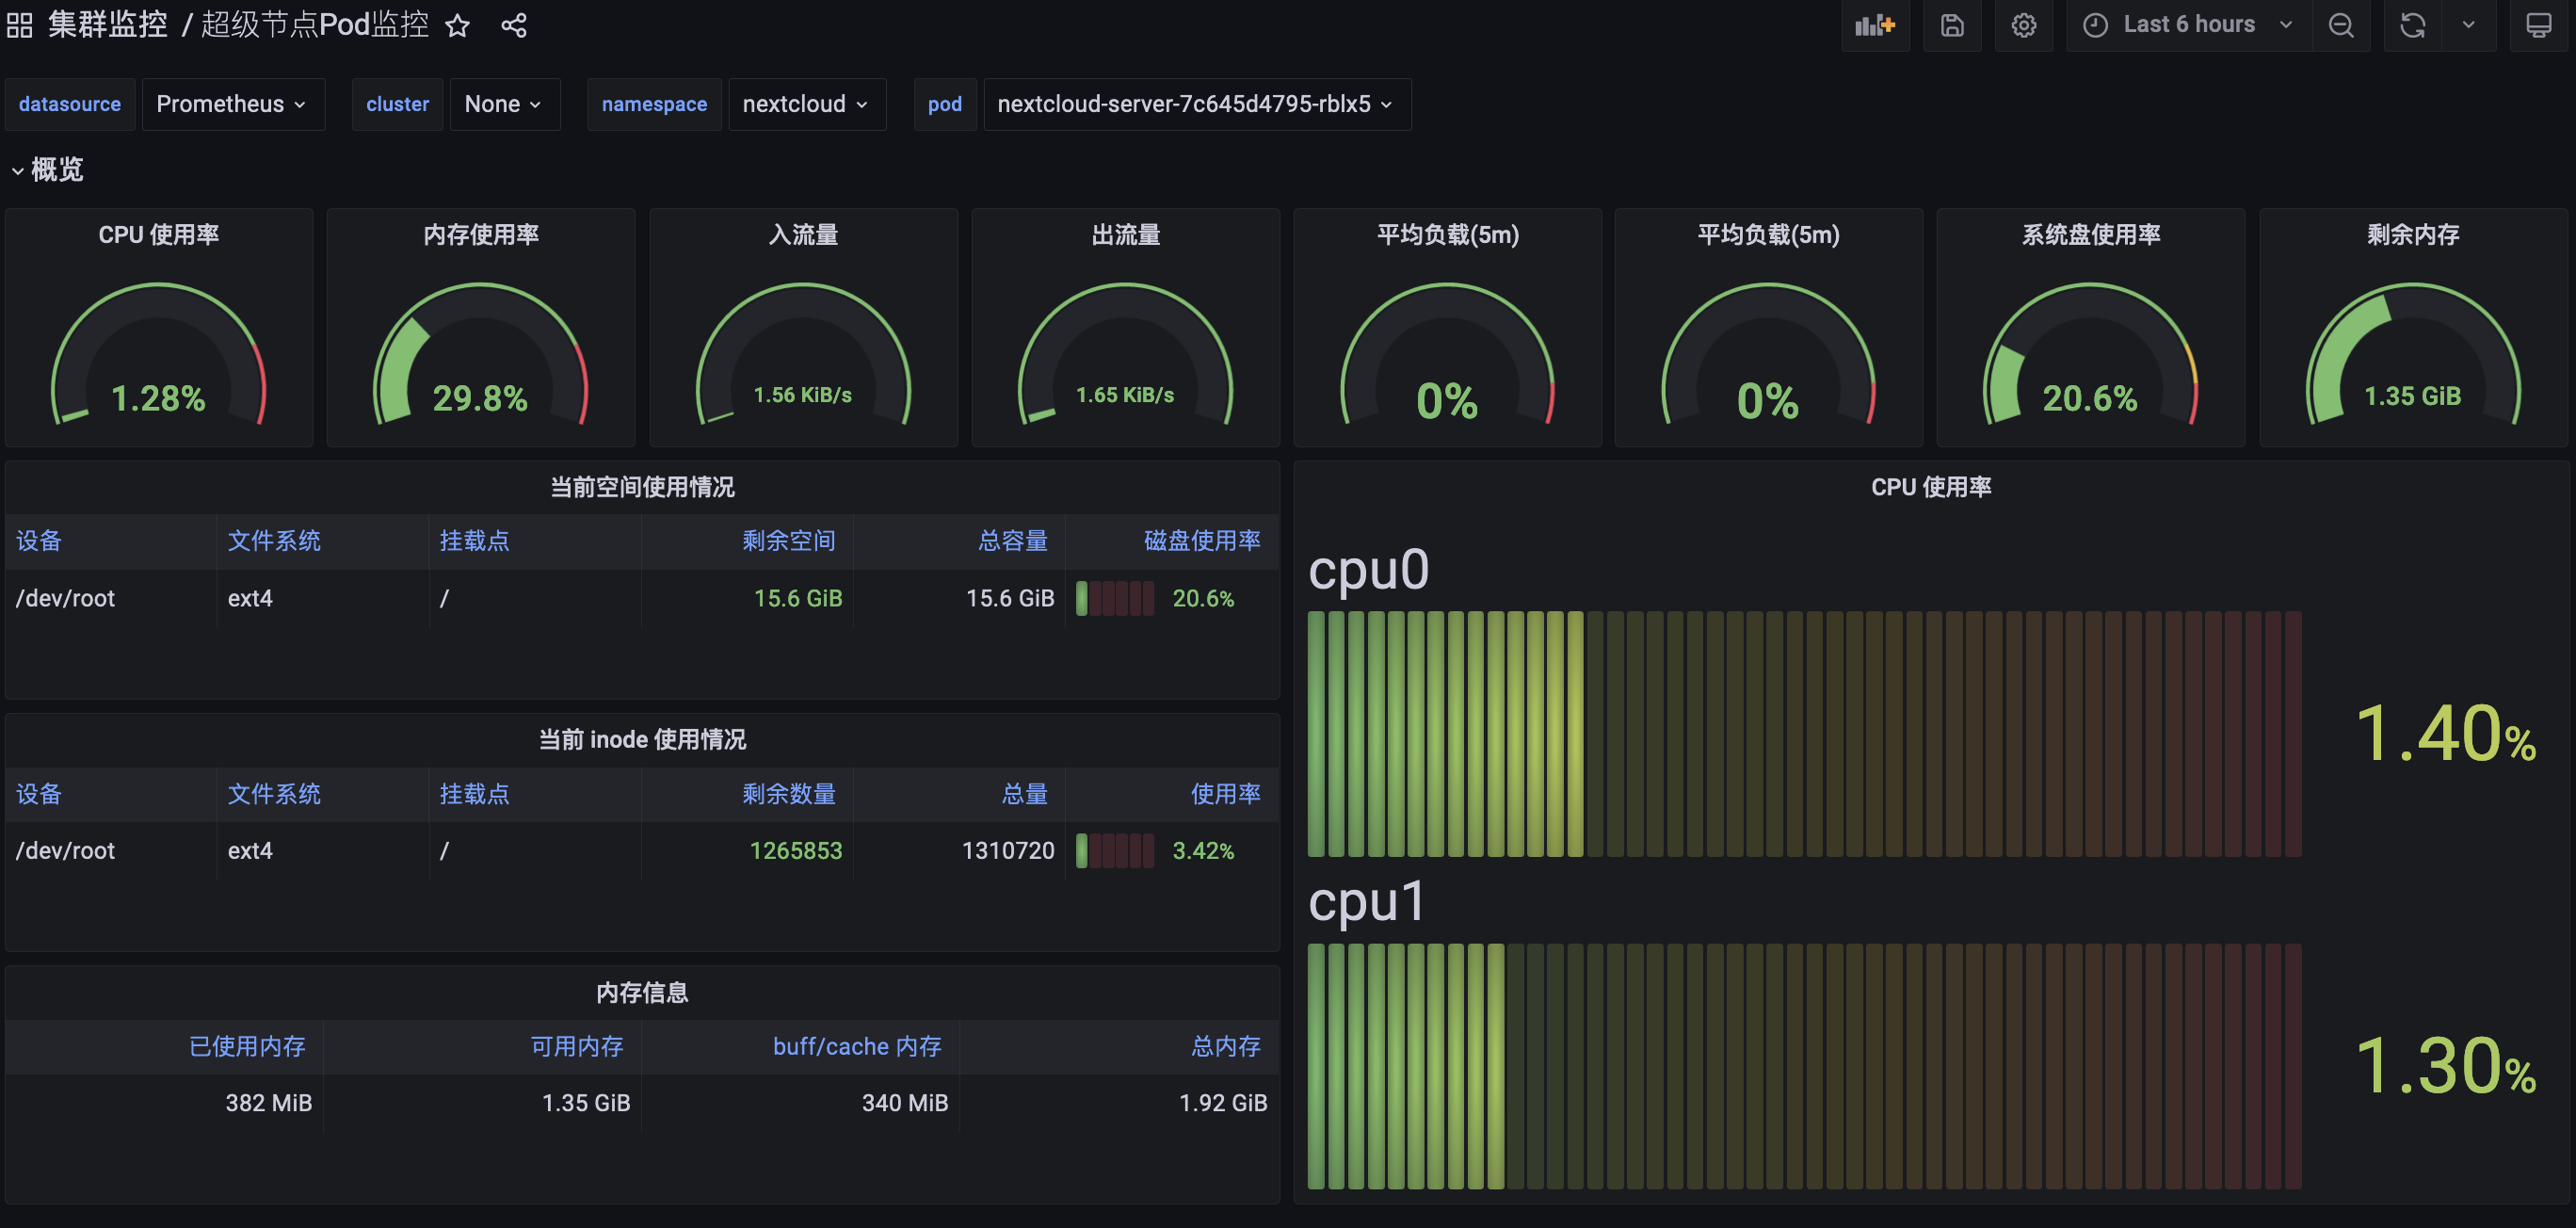
超级节点 Pod 监控仪表盘
概述
超级节点的 Pod 9100 端口提供了 Pod 所在虚拟机,机器维度的监控指标,实际上就是 node_exporter 的指标,只不过指标名由 node_ 前缀改为了 pod_ 前缀,基于这些指标可以捏出超级节点 Pod 监控仪表盘。
本文提供现成的超级节点 Pod 虚拟机维度的 Grafana 监控仪表盘。
需要 Grafana 9 以上版本。
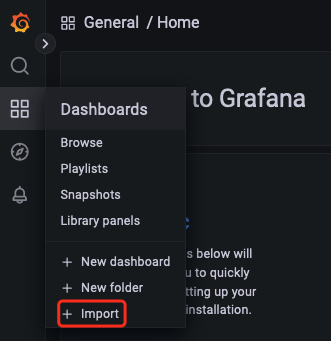
导入仪表盘
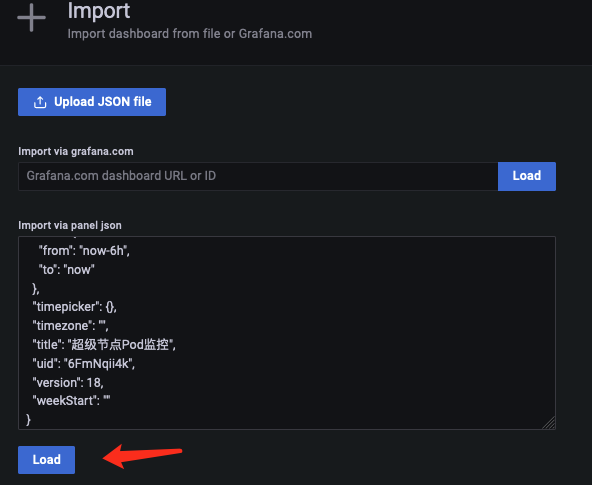
在 Grafana 中点击 Import:
将下面的 json 复制粘贴进去:
{
"__inputs": [
{
"name": "DS_PROMETHEUS",
"label": "Prometheus",
"description": "",
"type": "datasource",
"pluginId": "prometheus",
"pluginName": "Prometheus"
}
],
"__elements": {},
"__requires": [
{
"type": "panel",
"id": "bargauge",
"name": "Bar gauge",
"version": ""
},
{
"type": "panel",
"id": "gauge",
"name": "Gauge",
"version": ""
},
{
"type": "grafana",
"id": "grafana",
"name": "Grafana",
"version": "9.0.6"
},
{
"type": "datasource",
"id": "prometheus",
"name": "Prometheus",
"version": "1.0.0"
},
{
"type": "panel",
"id": "table",
"name": "Table",
"version": ""
},
{
"type": "panel",
"id": "timeseries",
"name": "Time series",
"version": ""
}
],
"annotations": {
"list": [
{
"builtIn": 1,
"datasource": {
"type": "grafana",
"uid": "-- Grafana --"
},
"enable": true,
"hide": true,
"iconColor": "rgba(0, 211, 255, 1)",
"name": "Annotations & Alerts",
"target": {
"limit": 100,
"matchAny": false,
"tags": [],
"type": "dashboard"
},
"type": "dashboard"
}
]
},
"description": "",
"editable": true,
"fiscalYearStartMonth": 0,
"graphTooltip": 0,
"id": null,
"links": [],
"liveNow": false,
"panels": [
{
"collapsed": false,
"gridPos": {
"h": 1,
"w": 24,
"x": 0,
"y": 0
},
"id": 53,
"panels": [],
"title": "概览",
"type": "row"
},
{
"datasource": {
"type": "prometheus",
"uid": "${DS_PROMETHEUS}"
},
"fieldConfig": {
"defaults": {
"color": {
"mode": "thresholds"
},
"mappings": [],
"max": 1,
"min": 0,
"thresholds": {
"mode": "absolute",
"steps": [
{
"color": "green",
"value": null
},
{
"color": "red",
"value": 0.8
}
]
},
"unit": "percentunit"
},
"overrides": []
},
"gridPos": {
"h": 4,
"w": 3,
"x": 0,
"y": 1
},
"id": 36,
"options": {
"orientation": "auto",
"reduceOptions": {
"calcs": [
"lastNotNull"
],
"fields": "",
"values": false
},
"showThresholdLabels": false,
"showThresholdMarkers": true
},
"pluginVersion": "9.0.6",
"targets": [
{
"datasource": {
"type": "prometheus",
"uid": "${DS_PROMETHEUS}"
},
"expr": "(\n 1 - \n avg(irate(pod_cpu_seconds_total{cluster=\"$cluster\", mode=\"idle\", namespace=\"$namespace\", pod=\"$pod\"}[2m]))\n)",
"refId": "A"
}
],
"title": "CPU 使用率",
"type": "gauge"
},
{
"datasource": {
"type": "prometheus",
"uid": "${DS_PROMETHEUS}"
},
"fieldConfig": {
"defaults": {
"color": {
"mode": "thresholds"
},
"mappings": [],
"max": 1,
"min": 0,
"thresholds": {
"mode": "absolute",
"steps": [
{
"color": "green",
"value": null
},
{
"color": "red",
"value": 0.8
}
]
},
"unit": "percentunit"
},
"overrides": []
},
"gridPos": {
"h": 4,
"w": 3,
"x": 3,
"y": 1
},
"id": 43,
"options": {
"orientation": "auto",
"reduceOptions": {
"calcs": [
"lastNotNull"
],
"fields": "",
"values": false
},
"showThresholdLabels": false,
"showThresholdMarkers": true
},
"pluginVersion": "9.0.6",
"targets": [
{
"datasource": {
"type": "prometheus",
"uid": "${DS_PROMETHEUS}"
},
"expr": "1 - (\n pod_memory_MemAvailable_bytes{cluster=\"$cluster\", namespace=\"$namespace\", pod=\"$pod\"} / pod_memory_MemTotal_bytes{cluster=\"$cluster\", namespace=\"$namespace\", pod=\"$pod\"}\n)",
"refId": "A"
}
],
"title": "内存使用率",
"type": "gauge"
},
{
"datasource": {
"type": "prometheus",
"uid": "${DS_PROMETHEUS}"
},
"fieldConfig": {
"defaults": {
"color": {
"mode": "thresholds"
},
"mappings": [],
"thresholds": {
"mode": "absolute",
"steps": [
{
"color": "green",
"value": null
},
{
"color": "red",
"value": 10737418240
}
]
},
"unit": "binBps"
},
"overrides": []
},
"gridPos": {
"h": 4,
"w": 3,
"x": 6,
"y": 1
},
"id": 38,
"options": {
"orientation": "auto",
"reduceOptions": {
"calcs": [
"lastNotNull"
],
"fields": "",
"values": false
},
"showThresholdLabels": false,
"showThresholdMarkers": true
},
"pluginVersion": "9.0.6",
"targets": [
{
"datasource": {
"type": "prometheus",
"uid": "${DS_PROMETHEUS}"
},
"expr": "sum(irate(pod_network_receive_bytes_total{cluster=\"$cluster\", namespace=\"$namespace\", pod=\"$pod\", device=\"eth0\"}[2m]))",
"refId": "A"
}
],
"title": "入流量",
"type": "gauge"
},
{
"datasource": {
"type": "prometheus",
"uid": "${DS_PROMETHEUS}"
},
"fieldConfig": {
"defaults": {
"color": {
"mode": "thresholds"
},
"mappings": [],
"thresholds": {
"mode": "absolute",
"steps": [
{
"color": "green",
"value": null
},
{
"color": "red",
"value": 10737418240
}
]
},
"unit": "binBps"
},
"overrides": []
},
"gridPos": {
"h": 4,
"w": 3,
"x": 9,
"y": 1
},
"id": 39,
"options": {
"orientation": "auto",
"reduceOptions": {
"calcs": [
"lastNotNull"
],
"fields": "",
"values": false
},
"showThresholdLabels": false,
"showThresholdMarkers": true
},
"pluginVersion": "9.0.6",
"targets": [
{
"datasource": {
"type": "prometheus",
"uid": "${DS_PROMETHEUS}"
},
"expr": "sum(irate(pod_network_transmit_bytes_total{cluster=\"$cluster\", namespace=\"$namespace\", pod=\"$pod\", device=\"eth0\"}[2m]))",
"refId": "A"
}
],
"title": "出流量",
"type": "gauge"
},
{
"datasource": {
"type": "prometheus",
"uid": "${DS_PROMETHEUS}"
},
"fieldConfig": {
"defaults": {
"color": {
"mode": "thresholds"
},
"mappings": [],
"max": 1,
"min": 0,
"thresholds": {
"mode": "absolute",
"steps": [
{
"color": "green",
"value": null
},
{
"color": "red",
"value": 0.9
}
]
},
"unit": "percentunit"
},
"overrides": []
},
"gridPos": {
"h": 4,
"w": 3,
"x": 12,
"y": 1
},
"id": 44,
"options": {
"orientation": "auto",
"reduceOptions": {
"calcs": [
"lastNotNull"
],
"fields": "",
"values": false
},
"showThresholdLabels": false,
"showThresholdMarkers": true,
"text": {}
},
"pluginVersion": "9.0.6",
"targets": [
{
"datasource": {
"type": "prometheus",
"uid": "${DS_PROMETHEUS}"
},
"editorMode": "code",
"expr": "avg(pod_load5{cluster=\"$cluster\", namespace=\"$namespace\", pod=\"$pod\"}) / count(count(pod_cpu_seconds_total{cluster=\"$cluster\", namespace=\"$namespace\", pod=\"$pod\"}) by (cpu))",
"legendFormat": "__auto",
"range": true,
"refId": "A"
}
],
"title": "平均负载(5m)",
"type": "gauge"
},
{
"datasource": {
"type": "prometheus",
"uid": "${DS_PROMETHEUS}"
},
"fieldConfig": {
"defaults": {
"color": {
"mode": "thresholds"
},
"mappings": [],
"max": 1,
"min": 0,
"thresholds": {
"mode": "absolute",
"steps": [
{
"color": "green",
"value": null
},
{
"color": "red",
"value": 0.9
}
]
},
"unit": "percentunit"
},
"overrides": []
},
"gridPos": {
"h": 4,
"w": 3,
"x": 15,
"y": 1
},
"id": 51,
"options": {
"orientation": "auto",
"reduceOptions": {
"calcs": [
"lastNotNull"
],
"fields": "",
"values": false
},
"showThresholdLabels": false,
"showThresholdMarkers": true,
"text": {}
},
"pluginVersion": "9.0.6",
"targets": [
{
"datasource": {
"type": "prometheus",
"uid": "${DS_PROMETHEUS}"
},
"editorMode": "code",
"expr": "avg(pod_load5{cluster=\"$cluster\", namespace=\"$namespace\", pod=\"$pod\"}) / count(count(pod_cpu_seconds_total{cluster=\"$cluster\", namespace=\"$namespace\", pod=\"$pod\"}) by (cpu))",
"legendFormat": "__auto",
"range": true,
"refId": "A"
}
],
"title": "平均负载(5m)",
"type": "gauge"
},
{
"datasource": {
"type": "prometheus",
"uid": "${DS_PROMETHEUS}"
},
"description": "",
"fieldConfig": {
"defaults": {
"color": {
"mode": "thresholds"
},
"mappings": [],
"max": 1,
"min": 0,
"thresholds": {
"mode": "absolute",
"steps": [
{
"color": "green",
"value": null
},
{
"color": "#EAB839",
"value": 0.8
},
{
"color": "red",
"value": 0.9
}
]
},
"unit": "percentunit"
},
"overrides": []
},
"gridPos": {
"h": 4,
"w": 3,
"x": 18,
"y": 1
},
"id": 48,
"options": {
"orientation": "auto",
"reduceOptions": {
"calcs": [
"lastNotNull"
],
"fields": "",
"values": false
},
"showThresholdLabels": false,
"showThresholdMarkers": true
},
"pluginVersion": "9.0.6",
"targets": [
{
"datasource": {
"type": "prometheus",
"uid": "${DS_PROMETHEUS}"
},
"expr": "1 - (\n pod_filesystem_avail_bytes{cluster=\"$cluster\", namespace=\"$namespace\", pod=\"$pod\", mountpoint=\"/\"} /\n pod_filesystem_size_bytes{cluster=\"$cluster\", namespace=\"$namespace\", pod=\"$pod\", mountpoint=\"/\"}\n)",
"refId": "A"
}
],
"title": "系统盘使用率",
"type": "gauge"
},
{
"datasource": {
"type": "prometheus",
"uid": "${DS_PROMETHEUS}"
},
"fieldConfig": {
"defaults": {
"color": {
"mode": "thresholds"
},
"mappings": [],
"thresholds": {
"mode": "absolute",
"steps": [
{
"color": "red",
"value": null
},
{
"color": "green",
"value": 1073741824
}
]
},
"unit": "bytes"
},
"overrides": []
},
"gridPos": {
"h": 4,
"w": 3,
"x": 21,
"y": 1
},
"id": 49,
"options": {
"orientation": "auto",
"reduceOptions": {
"calcs": [
"lastNotNull"
],
"fields": "",
"values": false
},
"showThresholdLabels": false,
"showThresholdMarkers": true
},
"pluginVersion": "9.0.6",
"targets": [
{
"datasource": {
"type": "prometheus",
"uid": "${DS_PROMETHEUS}"
},
"expr": "pod_memory_MemAvailable_bytes{cluster=\"$cluster\", namespace=\"$namespace\", pod=\"$pod\"}",
"refId": "A"
}
],
"title": "剩余内存",
"type": "gauge"
},
{
"datasource": {
"type": "prometheus",
"uid": "${DS_PROMETHEUS}"
},
"fieldConfig": {
"defaults": {
"color": {
"mode": "thresholds"
},
"custom": {
"align": "auto",
"displayMode": "auto",
"inspect": false,
"minWidth": 50
},
"mappings": [],
"thresholds": {
"mode": "absolute",
"steps": [
{
"color": "red",
"value": null
},
{
"color": "green",
"value": 10737418240
}
]
},
"unit": "bytes"
},
"overrides": [
{
"matcher": {
"id": "byName",
"options": "磁盘使用率"
},
"properties": [
{
"id": "unit",
"value": "percentunit"
},
{
"id": "custom.displayMode",
"value": "lcd-gauge"
},
{
"id": "thresholds",
"value": {
"mode": "absolute",
"steps": [
{
"color": "green",
"value": null
},
{
"color": "red",
"value": 80
}
]
}
}
]
},
{
"matcher": {
"id": "byName",
"options": "剩余空间"
},
"properties": [
{
"id": "custom.displayMode",
"value": "color-text"
}
]
}
]
},
"gridPos": {
"h": 4,
"w": 12,
"x": 0,
"y": 5
},
"id": 29,
"options": {
"footer": {
"fields": "",
"reducer": [
"sum"
],
"show": false
},
"showHeader": true,
"sortBy": [
{
"desc": true,
"displayName": "Value #A"
}
]
},
"pluginVersion": "9.0.6",
"targets": [
{
"datasource": {
"type": "prometheus",
"uid": "${DS_PROMETHEUS}"
},
"editorMode": "code",
"exemplar": false,
"expr": "pod_filesystem_avail_bytes{cluster=\"$cluster\", namespace=\"$namespace\", pod=\"$pod\", fstype!~\"nfs.*|tmpfs\"}",
"format": "table",
"instant": true,
"range": false,
"refId": "A"
},
{
"datasource": {
"type": "prometheus",
"uid": "${DS_PROMETHEUS}"
},
"editorMode": "code",
"exemplar": false,
"expr": "pod_filesystem_avail_bytes{cluster=\"$cluster\", namespace=\"$namespace\", pod=\"$pod\", fstype!~\"nfs.*|tmpfs\"}",
"format": "table",
"hide": false,
"instant": true,
"range": false,
"refId": "B"
},
{
"datasource": {
"type": "prometheus",
"uid": "${DS_PROMETHEUS}"
},
"editorMode": "code",
"exemplar": false,
"expr": "1 - \n(\n pod_filesystem_avail_bytes{cluster=\"$cluster\", namespace=\"$namespace\", pod=\"$pod\", fstype!~\"nfs.*|tmpfs\"}\n /\n pod_filesystem_size_bytes{cluster=\"$cluster\", namespace=\"$namespace\", pod=\"$pod\", fstype!~\"nfs.*|tmpfs\"}\n)",
"format": "table",
"hide": false,
"instant": true,
"range": false,
"refId": "C"
}
],
"title": "当前空间使用情况",
"transformations": [
{
"id": "filterFieldsByName",
"options": {
"include": {
"names": [
"mountpoint",
"Value #A",
"Value #B",
"Value #C",
"device",
"fstype"
]
}
}
},
{
"id": "seriesToColumns",
"options": {
"byField": "device"
}
},
{
"id": "organize",
"options": {
"excludeByName": {
"fstype 2": true,
"fstype 3": true,
"mountpoint 1": false,
"mountpoint 2": true,
"mountpoint 3": true
},
"indexByName": {},
"renameByName": {
"Value #A": "剩余空间",
"Value #B": "总容量",
"Value #C": "磁盘使用率",
"device": "设备",
"fstype": "文件系统",
"fstype 1": "文件系统",
"fstype 2": "",
"mountpoint": "挂载点",
"mountpoint 1": "挂载点"
}
}
}
],
"type": "table"
},
{
"datasource": {
"type": "prometheus",
"uid": "${DS_PROMETHEUS}"
},
"description": "",
"fieldConfig": {
"defaults": {
"color": {
"mode": "continuous-GrYlRd"
},
"mappings": [],
"thresholds": {
"mode": "absolute",
"steps": [
{
"color": "green",
"value": null
},
{
"color": "red",
"value": 80
}
]
},
"unit": "percentunit"
},
"overrides": []
},
"gridPos": {
"h": 12,
"w": 12,
"x": 12,
"y": 5
},
"id": 34,
"options": {
"displayMode": "lcd",
"minVizHeight": 10,
"minVizWidth": 0,
"orientation": "horizontal",
"reduceOptions": {
"calcs": [
"lastNotNull"
],
"fields": "",
"values": false
},
"showUnfilled": true
},
"pluginVersion": "9.0.6",
"targets": [
{
"datasource": {
"type": "prometheus",
"uid": "${DS_PROMETHEUS}"
},
"editorMode": "code",
"exemplar": false,
"expr": "(1 - avg(irate(pod_cpu_seconds_total{cluster=\"$cluster\", mode=\"idle\", namespace=\"$namespace\", pod=\"$pod\"}[2m])) by (cpu))",
"instant": false,
"legendFormat": "cpu{{cpu}}",
"range": true,
"refId": "A"
}
],
"title": "CPU 使用率",
"type": "bargauge"
},
{
"datasource": {
"type": "prometheus",
"uid": "${DS_PROMETHEUS}"
},
"fieldConfig": {
"defaults": {
"color": {
"mode": "thresholds"
},
"custom": {
"align": "auto",
"displayMode": "auto",
"inspect": false,
"minWidth": 50
},
"mappings": [],
"thresholds": {
"mode": "absolute",
"steps": [
{
"color": "red",
"value": null
},
{
"color": "green",
"value": 1000
}
]
},
"unit": "none"
},
"overrides": [
{
"matcher": {
"id": "byName",
"options": "使用率"
},
"properties": [
{
"id": "unit",
"value": "percentunit"
},
{
"id": "custom.displayMode",
"value": "lcd-gauge"
},
{
"id": "thresholds",
"value": {
"mode": "absolute",
"steps": [
{
"color": "green",
"value": null
},
{
"color": "red",
"value": 80
}
]
}
}
]
},
{
"matcher": {
"id": "byName",
"options": "剩余数量"
},
"properties": [
{
"id": "custom.displayMode",
"value": "color-text"
}
]
}
]
},
"gridPos": {
"h": 4,
"w": 12,
"x": 0,
"y": 9
},
"id": 42,
"options": {
"footer": {
"fields": "",
"reducer": [
"sum"
],
"show": false
},
"showHeader": true,
"sortBy": [
{
"desc": true,
"displayName": "Value #A"
}
]
},
"pluginVersion": "9.0.6",
"targets": [
{
"datasource": {
"type": "prometheus",
"uid": "${DS_PROMETHEUS}"
},
"editorMode": "code",
"exemplar": false,
"expr": "pod_filesystem_files_free{cluster=\"$cluster\", namespace=\"$namespace\", pod=\"$pod\", fstype!~\"nfs.*|tmpfs\"}",
"format": "table",
"instant": true,
"range": false,
"refId": "A"
},
{
"datasource": {
"type": "prometheus",
"uid": "${DS_PROMETHEUS}"
},
"editorMode": "code",
"exemplar": false,
"expr": "pod_filesystem_files{cluster=\"$cluster\", namespace=\"$namespace\", pod=\"$pod\", fstype!~\"nfs.*|tmpfs\"}",
"format": "table",
"hide": false,
"instant": true,
"range": false,
"refId": "B"
},
{
"datasource": {
"type": "prometheus",
"uid": "${DS_PROMETHEUS}"
},
"editorMode": "code",
"exemplar": false,
"expr": "1 - \n(\n pod_filesystem_files_free{cluster=\"$cluster\", namespace=\"$namespace\", pod=\"$pod\", fstype!~\"nfs.*|tmpfs\"}\n /\n pod_filesystem_files{cluster=\"$cluster\", namespace=\"$namespace\", pod=\"$pod\", fstype!~\"nfs.*|tmpfs\"}\n)",
"format": "table",
"hide": false,
"instant": true,
"range": false,
"refId": "C"
}
],
"title": "当前 inode 使用情况",
"transformations": [
{
"id": "filterFieldsByName",
"options": {
"include": {
"names": [
"mountpoint",
"Value #A",
"Value #B",
"Value #C",
"device",
"fstype"
]
}
}
},
{
"id": "seriesToColumns",
"options": {
"byField": "device"
}
},
{
"id": "organize",
"options": {
"excludeByName": {
"fstype 2": true,
"fstype 3": true,
"mountpoint 1": false,
"mountpoint 2": true,
"mountpoint 3": true
},
"indexByName": {},
"renameByName": {
"Value #A": "剩余数量",
"Value #B": "总量",
"Value #C": "使用率",
"device": "设备",
"fstype": "文件系统",
"fstype 1": "文件系统",
"fstype 2": "",
"mountpoint": "挂载点",
"mountpoint 1": "挂载点"
}
}
}
],
"type": "table"
},
{
"datasource": {
"type": "prometheus",
"uid": "${DS_PROMETHEUS}"
},
"description": "",
"fieldConfig": {
"defaults": {
"color": {
"mode": "thresholds"
},
"custom": {
"align": "auto",
"displayMode": "auto",
"inspect": false,
"minWidth": 50
},
"mappings": [],
"thresholds": {
"mode": "absolute",
"steps": [
{
"color": "red",
"value": null
},
{
"color": "green",
"value": 1000
}
]
},
"unit": "bytes"
},
"overrides": []
},
"gridPos": {
"h": 4,
"w": 12,
"x": 0,
"y": 13
},
"id": 50,
"options": {
"footer": {
"fields": "",
"reducer": [
"sum"
],
"show": false
},
"showHeader": true,
"sortBy": [
{
"desc": true,
"displayName": "Value #A"
}
]
},
"pluginVersion": "9.0.6",
"targets": [
{
"datasource": {
"type": "prometheus",
"uid": "${DS_PROMETHEUS}"
},
"editorMode": "code",
"exemplar": false,
"expr": "pod_memory_MemAvailable_bytes{cluster=\"$cluster\", namespace=\"$namespace\", pod=\"$pod\"}",
"format": "table",
"instant": true,
"range": false,
"refId": "A"
},
{
"datasource": {
"type": "prometheus",
"uid": "${DS_PROMETHEUS}"
},
"editorMode": "code",
"exemplar": false,
"expr": "pod_memory_MemTotal_bytes{cluster=\"$cluster\", namespace=\"$namespace\", pod=\"$pod\"}",
"format": "table",
"hide": false,
"instant": true,
"range": false,
"refId": "B"
},
{
"datasource": {
"type": "prometheus",
"uid": "${DS_PROMETHEUS}"
},
"editorMode": "code",
"exemplar": false,
"expr": "pod_memory_Buffers_bytes{cluster=\"$cluster\", namespace=\"$namespace\", pod=\"$pod\"} + pod_memory_Cached_bytes{cluster=\"$cluster\", namespace=\"$namespace\", pod=\"$pod\"} + pod_memory_SReclaimable_bytes{cluster=\"$cluster\", namespace=\"$namespace\", pod=\"$pod\"}",
"format": "table",
"hide": false,
"instant": true,
"range": false,
"refId": "C"
},
{
"datasource": {
"type": "prometheus",
"uid": "${DS_PROMETHEUS}"
},
"editorMode": "code",
"exemplar": false,
"expr": "pod_memory_MemTotal_bytes{cluster=\"$cluster\", namespace=\"$namespace\", pod=\"$pod\"} - pod_memory_Buffers_bytes{cluster=\"$cluster\", namespace=\"$namespace\", pod=\"$pod\"} - pod_memory_Cached_bytes{cluster=\"$cluster\", namespace=\"$namespace\", pod=\"$pod\"} - pod_memory_MemFree_bytes{cluster=\"$cluster\", namespace=\"$namespace\", pod=\"$pod\"} - pod_memory_SReclaimable_bytes{cluster=\"$cluster\", namespace=\"$namespace\", pod=\"$pod\"}",
"format": "table",
"hide": false,
"instant": true,
"range": false,
"refId": "D"
}
],
"title": "内存信息",
"transformations": [
{
"id": "filterFieldsByName",
"options": {
"include": {
"names": [
"instance",
"Value #A",
"Value #B",
"Value #C",
"Value #D"
]
}
}
},
{
"id": "seriesToColumns",
"options": {
"byField": "instance"
}
},
{
"id": "organize",
"options": {
"excludeByName": {
"instance": true
},
"indexByName": {
"Value #A": 2,
"Value #B": 4,
"Value #C": 3,
"Value #D": 1,
"instance": 0
},
"renameByName": {
"Value #A": "可用内存",
"Value #B": "总内存",
"Value #C": "buff/cache 内存",
"Value #D": "已使用内存"
}
}
}
],
"type": "table"
},
{
"collapsed": false,
"gridPos": {
"h": 1,
"w": 24,
"x": 0,
"y": 17
},
"id": 31,
"panels": [],
"title": "存储",
"type": "row"
},
{
"datasource": {
"type": "prometheus",
"uid": "${DS_PROMETHEUS}"
},
"fieldConfig": {
"defaults": {
"color": {
"mode": "palette-classic"
},
"custom": {
"axisLabel": "",
"axisPlacement": "auto",
"barAlignment": 0,
"drawStyle": "line",
"fillOpacity": 0,
"gradientMode": "none",
"hideFrom": {
"legend": false,
"tooltip": false,
"viz": false
},
"lineInterpolation": "linear",
"lineWidth": 1,
"pointSize": 5,
"scaleDistribution": {
"type": "linear"
},
"showPoints": "auto",
"spanNulls": false,
"stacking": {
"group": "A",
"mode": "none"
},
"thresholdsStyle": {
"mode": "off"
}
},
"mappings": [],
"thresholds": {
"mode": "absolute",
"steps": [
{
"color": "red",
"value": null
},
{
"color": "green",
"value": 10
}
]
},
"unit": "bytes"
},
"overrides": [
{
"matcher": {
"id": "byFrameRefID",
"options": "B"
},
"properties": [
{
"id": "unit",
"value": "percentunit"
}
]
}
]
},
"gridPos": {
"h": 8,
"w": 12,
"x": 0,
"y": 18
},
"id": 40,
"options": {
"legend": {
"calcs": [],
"displayMode": "list",
"placement": "bottom"
},
"tooltip": {
"mode": "multi",
"sort": "desc"
}
},
"pluginVersion": "9.0.4",
"targets": [
{
"datasource": {
"type": "prometheus",
"uid": "${DS_PROMETHEUS}"
},
"editorMode": "code",
"exemplar": false,
"expr": "pod_filesystem_size_bytes{cluster=\"$cluster\", namespace=\"$namespace\", pod=\"$pod\", fstype!~\"nfs.*|tmpfs\"} - pod_filesystem_free_bytes{cluster=\"$cluster\", namespace=\"$namespace\", pod=\"$pod\", fstype!~\"nfs.*|tmpfs\"}",
"format": "time_series",
"instant": false,
"legendFormat": "{{mountpoint}} 使用量",
"range": true,
"refId": "A"
},
{
"datasource": {
"type": "prometheus",
"uid": "${DS_PROMETHEUS}"
},
"editorMode": "code",
"expr": "(pod_filesystem_size_bytes{cluster=\"$cluster\", namespace=\"$namespace\", pod=\"$pod\", fstype!~\"nfs.*|tmpfs\"} - pod_filesystem_free_bytes{cluster=\"$cluster\", namespace=\"$namespace\", pod=\"$pod\", fstype!~\"nfs.*|tmpfs\"}) /\npod_filesystem_size_bytes{cluster=\"$cluster\", namespace=\"$namespace\", pod=\"$pod\", fstype!~\"nfs.*|tmpfs\"}",
"hide": false,
"legendFormat": "{{mountpoint}} 使用率",
"range": true,
"refId": "B"
}
],
"title": "磁盘空间使用情况",
"transformations": [],
"type": "timeseries"
},
{
"datasource": {
"type": "prometheus",
"uid": "${DS_PROMETHEUS}"
},
"fieldConfig": {
"defaults": {
"color": {
"mode": "palette-classic"
},
"custom": {
"axisLabel": "",
"axisPlacement": "auto",
"barAlignment": 0,
"drawStyle": "line",
"fillOpacity": 0,
"gradientMode": "none",
"hideFrom": {
"legend": false,
"tooltip": false,
"viz": false
},
"lineInterpolation": "linear",
"lineWidth": 1,
"pointSize": 5,
"scaleDistribution": {
"type": "linear"
},
"showPoints": "auto",
"spanNulls": false,
"stacking": {
"group": "A",
"mode": "none"
},
"thresholdsStyle": {
"mode": "off"
}
},
"mappings": [],
"thresholds": {
"mode": "absolute",
"steps": [
{
"color": "red",
"value": null
},
{
"color": "green",
"value": 10
}
]
},
"unit": "none"
},
"overrides": [
{
"matcher": {
"id": "byFrameRefID",
"options": "B"
},
"properties": [
{
"id": "unit",
"value": "percentunit"
}
]
}
]
},
"gridPos": {
"h": 8,
"w": 12,
"x": 12,
"y": 18
},
"id": 41,
"options": {
"legend": {
"calcs": [],
"displayMode": "list",
"placement": "bottom"
},
"tooltip": {
"mode": "multi",
"sort": "desc"
}
},
"pluginVersion": "9.0.4",
"targets": [
{
"datasource": {
"type": "prometheus",
"uid": "${DS_PROMETHEUS}"
},
"editorMode": "code",
"exemplar": false,
"expr": "pod_filesystem_files{cluster=\"$cluster\", namespace=\"$namespace\", pod=\"$pod\", fstype!~\"nfs.*|tmpfs\"} - pod_filesystem_files_free{cluster=\"$cluster\", namespace=\"$namespace\", pod=\"$pod\", fstype!~\"nfs.*|tmpfs\"}",
"format": "time_series",
"instant": false,
"legendFormat": "{{mountpoint}} 使用量",
"range": true,
"refId": "A"
},
{
"datasource": {
"type": "prometheus",
"uid": "${DS_PROMETHEUS}"
},
"editorMode": "code",
"expr": "(pod_filesystem_files{cluster=\"$cluster\", namespace=\"$namespace\", pod=\"$pod\", fstype!~\"nfs.*|tmpfs\"} - pod_filesystem_files_free{cluster=\"$cluster\", namespace=\"$namespace\", pod=\"$pod\", fstype!~\"nfs.*|tmpfs\"}) /\npod_filesystem_files{cluster=\"$cluster\", namespace=\"$namespace\", pod=\"$pod\", fstype!~\"nfs.*|tmpfs\"}",
"hide": false,
"legendFormat": "{{mountpoint}} 使用率",
"range": true,
"refId": "B"
}
],
"title": "磁盘 inode 使用情况",
"transformations": [],
"type": "timeseries"
},
{
"collapsed": false,
"gridPos": {
"h": 1,
"w": 24,
"x": 0,
"y": 26
},
"id": 16,
"panels": [],
"title": "计算",
"type": "row"
},
{
"datasource": {
"type": "prometheus",
"uid": "${DS_PROMETHEUS}"
},
"fieldConfig": {
"defaults": {
"color": {
"mode": "palette-classic"
},
"custom": {
"axisLabel": "",
"axisPlacement": "left",
"barAlignment": 0,
"drawStyle": "line",
"fillOpacity": 0,
"gradientMode": "none",
"hideFrom": {
"legend": false,
"tooltip": false,
"viz": false
},
"lineInterpolation": "linear",
"lineWidth": 1,
"pointSize": 5,
"scaleDistribution": {
"type": "linear"
},
"showPoints": "auto",
"spanNulls": false,
"stacking": {
"group": "A",
"mode": "none"
},
"thresholdsStyle": {
"mode": "off"
}
},
"mappings": [],
"thresholds": {
"mode": "absolute",
"steps": [
{
"color": "green",
"value": null
},
{
"color": "red",
"value": 80
}
]
},
"unit": "percentunit"
},
"overrides": [
{
"matcher": {
"id": "byName",
"options": "内存使用率"
},
"properties": [
{
"id": "custom.axisPlacement",
"value": "right"
}
]
}
]
},
"gridPos": {
"h": 9,
"w": 12,
"x": 0,
"y": 27
},
"id": 25,
"options": {
"legend": {
"calcs": [
"mean",
"max",
"last"
],
"displayMode": "list",
"placement": "bottom"
},
"tooltip": {
"mode": "multi",
"sort": "desc"
}
},
"targets": [
{
"datasource": {
"type": "prometheus",
"uid": "${DS_PROMETHEUS}"
},
"editorMode": "code",
"expr": "(\n1 - \n (\n pod_memory_MemAvailable_bytes{cluster=\"$cluster\", namespace=\"$namespace\", pod=\"$pod\"} / \n pod_memory_MemTotal_bytes{cluster=\"$cluster\", namespace=\"$namespace\", pod=\"$pod\"}\n )\n)",
"hide": false,
"legendFormat": "内存使用率",
"range": true,
"refId": "B"
},
{
"datasource": {
"type": "prometheus",
"uid": "${DS_PROMETHEUS}"
},
"editorMode": "code",
"expr": "(1 - avg(irate(pod_cpu_seconds_total{cluster=\"$cluster\", mode=\"idle\", namespace=\"$namespace\", pod=\"$pod\"}[2m])))",
"hide": false,
"legendFormat": "CPU 使用率",
"range": true,
"refId": "A"
}
],
"title": "CPU/内存 使用率",
"type": "timeseries"
},
{
"datasource": {
"type": "prometheus",
"uid": "${DS_PROMETHEUS}"
},
"fieldConfig": {
"defaults": {
"color": {
"mode": "palette-classic"
},
"custom": {
"axisLabel": "",
"axisPlacement": "auto",
"barAlignment": 0,
"drawStyle": "line",
"fillOpacity": 0,
"gradientMode": "none",
"hideFrom": {
"legend": false,
"tooltip": false,
"viz": false
},
"lineInterpolation": "linear",
"lineWidth": 1,
"pointSize": 5,
"scaleDistribution": {
"type": "linear"
},
"showPoints": "auto",
"spanNulls": false,
"stacking": {
"group": "A",
"mode": "none"
},
"thresholdsStyle": {
"mode": "off"
}
},
"mappings": [],
"thresholds": {
"mode": "absolute",
"steps": [
{
"color": "green",
"value": null
},
{
"color": "red",
"value": 80
}
]
},
"unit": "percentunit"
},
"overrides": []
},
"gridPos": {
"h": 9,
"w": 12,
"x": 12,
"y": 27
},
"id": 27,
"options": {
"legend": {
"calcs": [],
"displayMode": "list",
"placement": "bottom"
},
"tooltip": {
"mode": "multi",
"sort": "desc"
}
},
"targets": [
{
"datasource": {
"type": "prometheus",
"uid": "${DS_PROMETHEUS}"
},
"editorMode": "code",
"expr": "(1 - avg(irate(pod_cpu_seconds_total{cluster=\"$cluster\", mode=\"idle\", namespace=\"$namespace\", pod=\"$pod\"}[2m])) by (cpu))",
"legendFormat": "{{cpu}}",
"range": true,
"refId": "A"
}
],
"title": "CPU 使用率(单核)",
"type": "timeseries"
},
{
"datasource": {
"type": "prometheus",
"uid": "${DS_PROMETHEUS}"
},
"fieldConfig": {
"defaults": {
"color": {
"mode": "palette-classic"
},
"custom": {
"axisLabel": "",
"axisPlacement": "auto",
"barAlignment": 0,
"drawStyle": "line",
"fillOpacity": 0,
"gradientMode": "none",
"hideFrom": {
"legend": false,
"tooltip": false,
"viz": false
},
"lineInterpolation": "linear",
"lineWidth": 1,
"pointSize": 5,
"scaleDistribution": {
"type": "linear"
},
"showPoints": "auto",
"spanNulls": false,
"stacking": {
"group": "A",
"mode": "none"
},
"thresholdsStyle": {
"mode": "off"
}
},
"mappings": [],
"thresholds": {
"mode": "absolute",
"steps": [
{
"color": "green",
"value": null
},
{
"color": "red",
"value": 80
}
]
}
},
"overrides": []
},
"gridPos": {
"h": 9,
"w": 12,
"x": 0,
"y": 36
},
"id": 19,
"options": {
"legend": {
"calcs": [],
"displayMode": "list",
"placement": "bottom"
},
"tooltip": {
"mode": "multi",
"sort": "desc"
}
},
"targets": [
{
"datasource": {
"type": "prometheus",
"uid": "${DS_PROMETHEUS}"
},
"editorMode": "code",
"expr": "pod_load1{cluster=\"$cluster\", namespace=\"$namespace\", pod=\"$pod\"}",
"hide": false,
"legendFormat": "1min",
"range": true,
"refId": "B"
},
{
"datasource": {
"type": "prometheus",
"uid": "${DS_PROMETHEUS}"
},
"editorMode": "code",
"expr": "pod_load5{cluster=\"$cluster\", namespace=\"$namespace\", pod=\"$pod\"}",
"hide": false,
"legendFormat": "5min",
"range": true,
"refId": "A"
},
{
"datasource": {
"type": "prometheus",
"uid": "${DS_PROMETHEUS}"
},
"editorMode": "code",
"expr": "pod_load15{cluster=\"$cluster\", namespace=\"$namespace\", pod=\"$pod\"}",
"hide": false,
"legendFormat": "15min",
"range": true,
"refId": "C"
}
],
"title": "平均负载",
"type": "timeseries"
},
{
"datasource": {
"type": "prometheus",
"uid": "${DS_PROMETHEUS}"
},
"description": "",
"fieldConfig": {
"defaults": {
"color": {
"mode": "palette-classic"
},
"custom": {
"axisLabel": "",
"axisPlacement": "auto",
"barAlignment": 0,
"drawStyle": "line",
"fillOpacity": 0,
"gradientMode": "none",
"hideFrom": {
"legend": false,
"tooltip": false,
"viz": false
},
"lineInterpolation": "linear",
"lineWidth": 1,
"pointSize": 5,
"scaleDistribution": {
"type": "linear"
},
"showPoints": "auto",
"spanNulls": false,
"stacking": {
"group": "A",
"mode": "none"
},
"thresholdsStyle": {
"mode": "off"
}
},
"mappings": [],
"thresholds": {
"mode": "absolute",
"steps": [
{
"color": "green",
"value": null
},
{
"color": "red",
"value": 80
}
]
},
"unit": "percentunit"
},
"overrides": []
},
"gridPos": {
"h": 9,
"w": 12,
"x": 12,
"y": 36
},
"id": 22,
"options": {
"legend": {
"calcs": [],
"displayMode": "list",
"placement": "bottom"
},
"tooltip": {
"mode": "multi",
"sort": "desc"
}
},
"targets": [
{
"datasource": {
"type": "prometheus",
"uid": "${DS_PROMETHEUS}"
},
"editorMode": "code",
"expr": "avg(irate(pod_cpu_seconds_total{cluster=\"$cluster\", namespace=\"$namespace\", pod=\"$pod\", mode!=\"idle\"}[2m])) by (instance, mode)",
"hide": false,
"legendFormat": "{{mode}}",
"range": true,
"refId": "A"
}
],
"title": "CPU 使用率明细",
"type": "timeseries"
},
{
"collapsed": false,
"gridPos": {
"h": 1,
"w": 24,
"x": 0,
"y": 45
},
"id": 57,
"panels": [],
"title": "网络",
"type": "row"
},
{
"datasource": {
"type": "prometheus",
"uid": "${DS_PROMETHEUS}"
},
"fieldConfig": {
"defaults": {
"color": {
"mode": "palette-classic"
},
"custom": {
"axisLabel": "",
"axisPlacement": "auto",
"barAlignment": 0,
"drawStyle": "line",
"fillOpacity": 0,
"gradientMode": "none",
"hideFrom": {
"legend": false,
"tooltip": false,
"viz": false
},
"lineInterpolation": "linear",
"lineWidth": 1,
"pointSize": 5,
"scaleDistribution": {
"type": "linear"
},
"showPoints": "auto",
"spanNulls": false,
"stacking": {
"group": "A",
"mode": "none"
},
"thresholdsStyle": {
"mode": "off"
}
},
"mappings": [],
"thresholds": {
"mode": "absolute",
"steps": [
{
"color": "green",
"value": null
},
{
"color": "red",
"value": 80
}
]
},
"unit": "binBps"
},
"overrides": []
},
"gridPos": {
"h": 8,
"w": 12,
"x": 0,
"y": 46
},
"id": 55,
"options": {
"legend": {
"calcs": [],
"displayMode": "list",
"placement": "bottom"
},
"tooltip": {
"mode": "single",
"sort": "none"
}
},
"targets": [
{
"datasource": {
"type": "prometheus",
"uid": "${DS_PROMETHEUS}"
},
"editorMode": "code",
"expr": "sum(irate(pod_network_receive_bytes_total{cluster=\"$cluster\", namespace=\"$namespace\", pod=\"$pod\", device=\"eth0\"}[2m]))",
"legendFormat": "入流量",
"range": true,
"refId": "A"
},
{
"datasource": {
"type": "prometheus",
"uid": "${DS_PROMETHEUS}"
},
"editorMode": "code",
"expr": "-sum(irate(pod_network_transmit_bytes_total{cluster=\"$cluster\", namespace=\"$namespace\", pod=\"$pod\", device=\"eth0\"}[2m]))",
"hide": false,
"legendFormat": "出流量",
"range": true,
"refId": "B"
}
],
"title": "网络流量",
"type": "timeseries"
},
{
"datasource": {
"type": "prometheus",
"uid": "${DS_PROMETHEUS}"
},
"fieldConfig": {
"defaults": {
"color": {
"mode": "palette-classic"
},
"custom": {
"axisLabel": "",
"axisPlacement": "auto",
"barAlignment": 0,
"drawStyle": "line",
"fillOpacity": 0,
"gradientMode": "none",
"hideFrom": {
"legend": false,
"tooltip": false,
"viz": false
},
"lineInterpolation": "linear",
"lineWidth": 1,
"pointSize": 5,
"scaleDistribution": {
"type": "linear"
},
"showPoints": "auto",
"spanNulls": false,
"stacking": {
"group": "A",
"mode": "none"
},
"thresholdsStyle": {
"mode": "off"
}
},
"mappings": [],
"thresholds": {
"mode": "absolute",
"steps": [
{
"color": "green",
"value": null
},
{
"color": "red",
"value": 80
}
]
},
"unit": "pps"
},
"overrides": []
},
"gridPos": {
"h": 8,
"w": 12,
"x": 12,
"y": 46
},
"id": 58,
"options": {
"legend": {
"calcs": [],
"displayMode": "list",
"placement": "bottom"
},
"tooltip": {
"mode": "single",
"sort": "none"
}
},
"targets": [
{
"datasource": {
"type": "prometheus",
"uid": "${DS_PROMETHEUS}"
},
"editorMode": "code",
"expr": "sum(irate(pod_network_receive_drop_total{cluster=\"$cluster\", namespace=\"$namespace\", pod=\"$pod\", device=\"eth0\"}[2m]))",
"legendFormat": "接收丢包速率",
"range": true,
"refId": "A"
},
{
"datasource": {
"type": "prometheus",
"uid": "${DS_PROMETHEUS}"
},
"editorMode": "code",
"expr": "-sum(irate(pod_network_transmit_drop_total{cluster=\"$cluster\", namespace=\"$namespace\", pod=\"$pod\", device=\"eth0\"}[2m]))",
"hide": false,
"legendFormat": "发送丢包速率",
"range": true,
"refId": "B"
},
{
"datasource": {
"type": "prometheus",
"uid": "${DS_PROMETHEUS}"
},
"editorMode": "code",
"expr": "sum(irate(pod_network_receive_errs_total{cluster=\"$cluster\", namespace=\"$namespace\", pod=\"$pod\", device=\"eth0\"}[2m]))",
"hide": false,
"legendFormat": "接收错误速率",
"range": true,
"refId": "C"
},
{
"datasource": {
"type": "prometheus",
"uid": "${DS_PROMETHEUS}"
},
"editorMode": "code",
"expr": "-sum(irate(pod_network_transmit_errs_total{cluster=\"$cluster\", namespace=\"$namespace\", pod=\"$pod\", device=\"eth0\"}[2m]))",
"hide": false,
"legendFormat": "发送错误速率",
"range": true,
"refId": "D"
}
],
"title": "异常数据包",
"type": "timeseries"
}
],
"refresh": false,
"schemaVersion": 36,
"style": "dark",
"tags": [],
"templating": {
"list": [
{
"current": {
"selected": false,
"text": "Prometheus",
"value": "Prometheus"
},
"hide": 0,
"includeAll": false,
"multi": false,
"name": "datasource",
"options": [],
"query": "prometheus",
"queryValue": "",
"refresh": 1,
"regex": "",
"skipUrlSync": false,
"type": "datasource"
},
{
"current": {},
"datasource": {
"type": "prometheus",
"uid": "${DS_PROMETHEUS}"
},
"definition": "label_values(up{}, cluster)",
"hide": 0,
"includeAll": false,
"multi": false,
"name": "cluster",
"options": [],
"query": {
"query": "label_values(up{}, cluster)",
"refId": "StandardVariableQuery"
},
"refresh": 1,
"regex": "",
"skipUrlSync": false,
"sort": 0,
"type": "query"
},
{
"current": {},
"datasource": {
"type": "prometheus",
"uid": "${DS_PROMETHEUS}"
},
"definition": "label_values(pod_load1{}, namespace)",
"hide": 0,
"includeAll": false,
"multi": false,
"name": "namespace",
"options": [],
"query": {
"query": "label_values(pod_load1{}, namespace)",
"refId": "StandardVariableQuery"
},
"refresh": 1,
"regex": "",
"skipUrlSync": false,
"sort": 0,
"type": "query"
},
{
"current": {},
"datasource": {
"type": "prometheus",
"uid": "${DS_PROMETHEUS}"
},
"definition": "label_values(pod_load1{namespace=\"$namespace\"}, pod)",
"hide": 0,
"includeAll": false,
"multi": false,
"name": "pod",
"options": [],
"query": {
"query": "label_values(pod_load1{namespace=\"$namespace\"}, pod)",
"refId": "StandardVariableQuery"
},
"refresh": 1,
"regex": "",
"skipUrlSync": false,
"sort": 0,
"type": "query"
}
]
},
"time": {
"from": "now-6h",
"to": "now"
},
"timepicker": {},
"timezone": "",
"title": "超级节点Pod监控",
"uid": "6FmNqii4k",
"version": 18,
"weekStart": ""
}
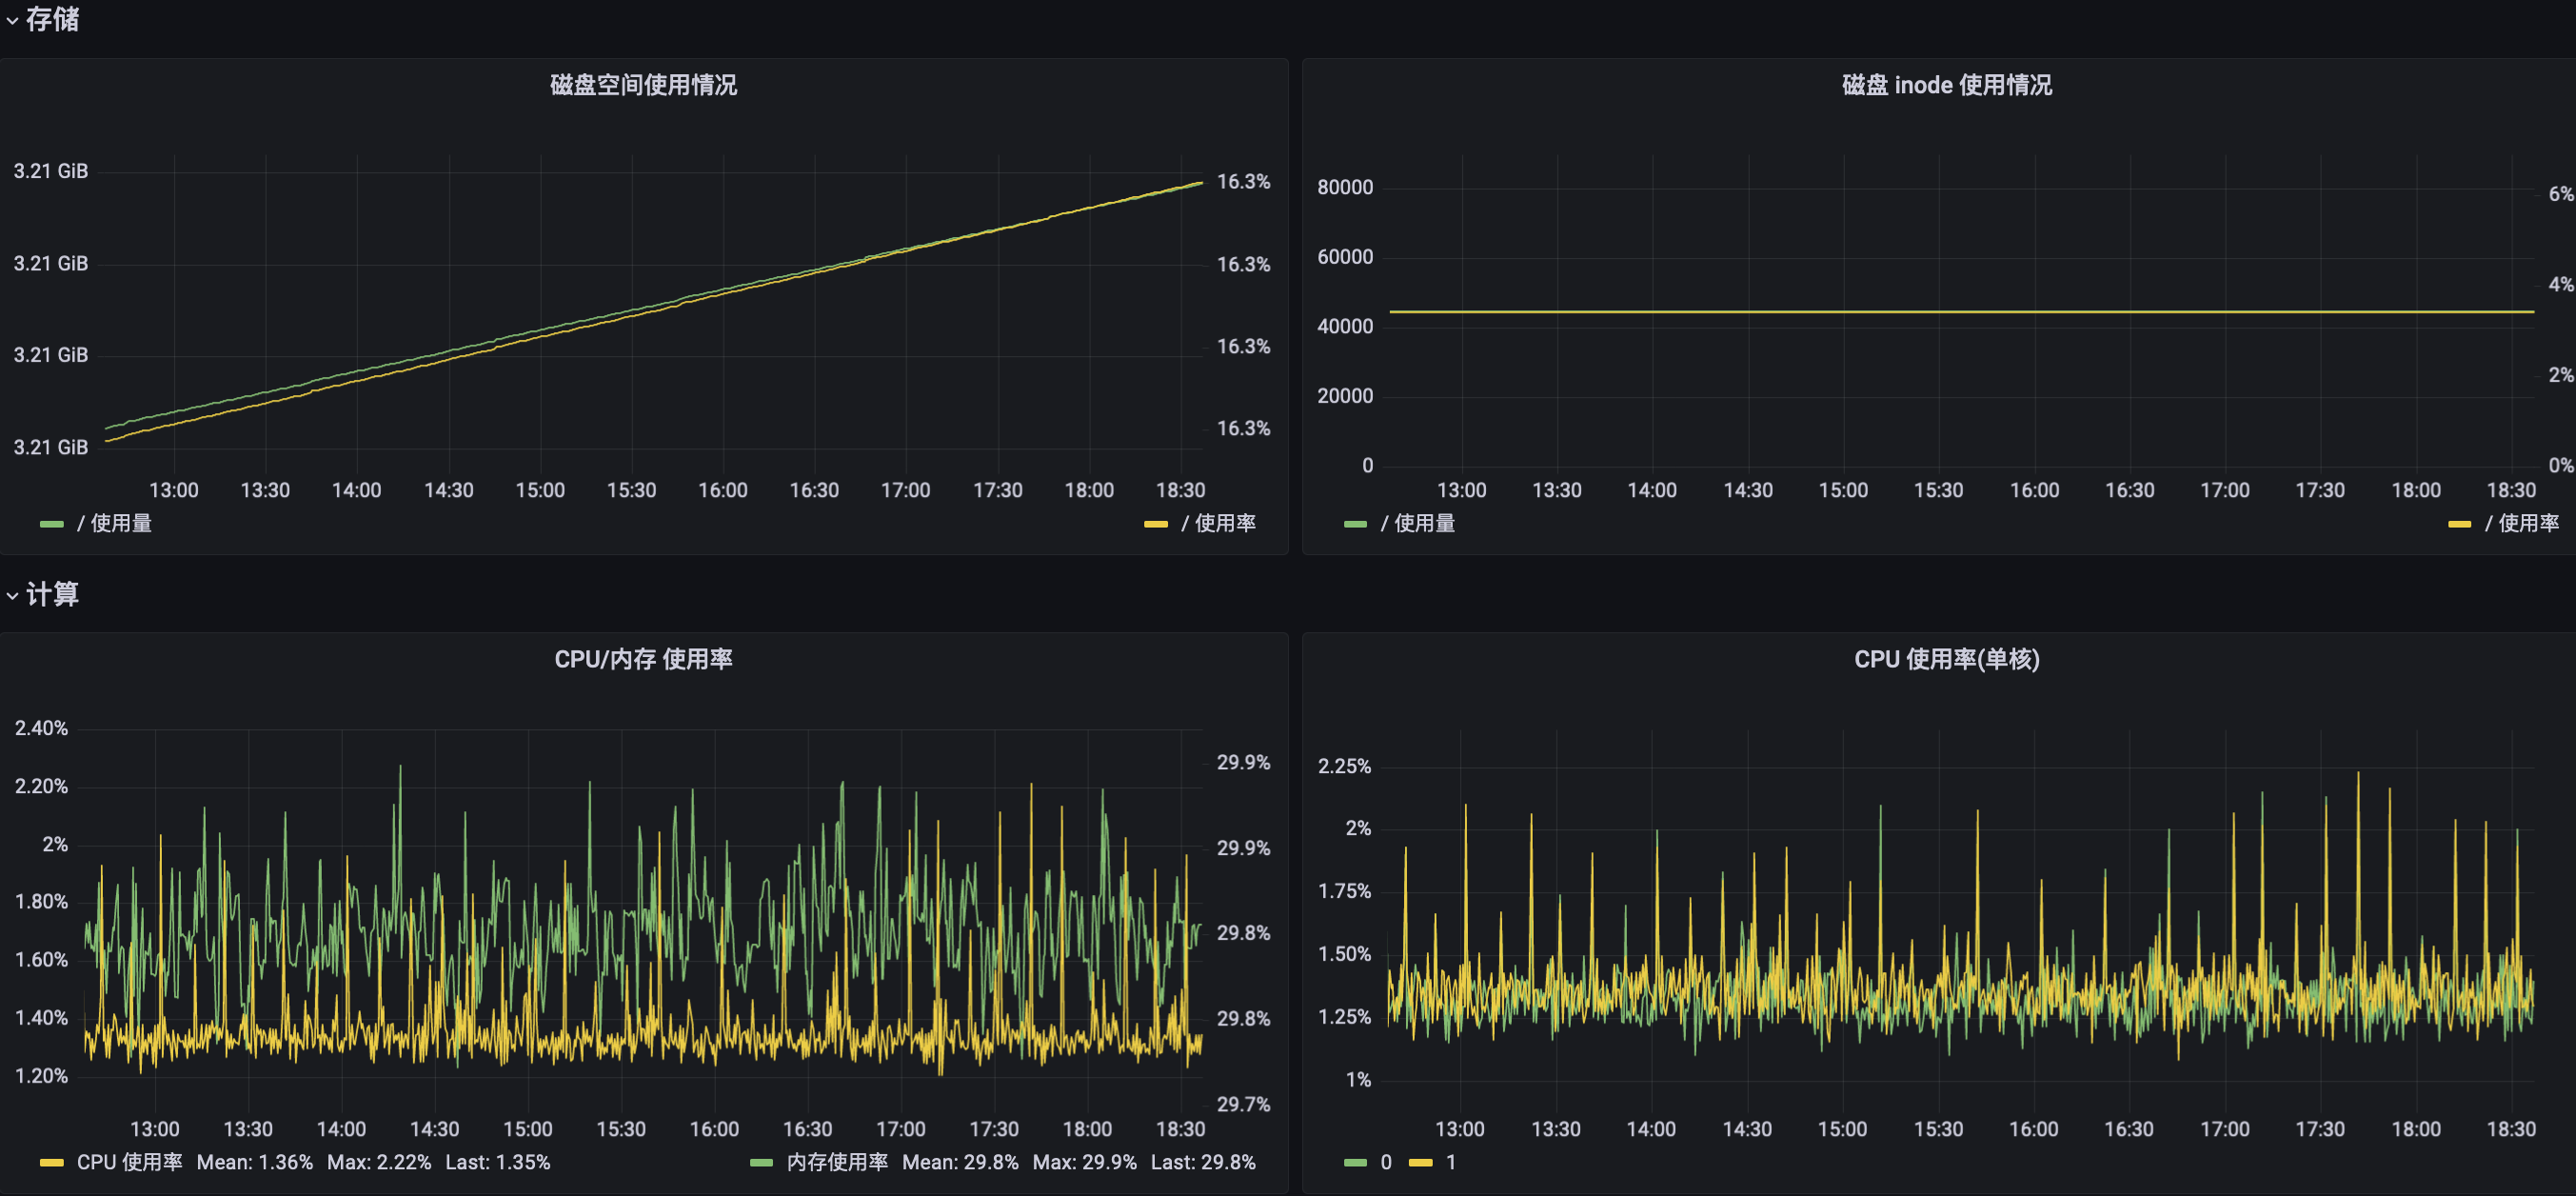
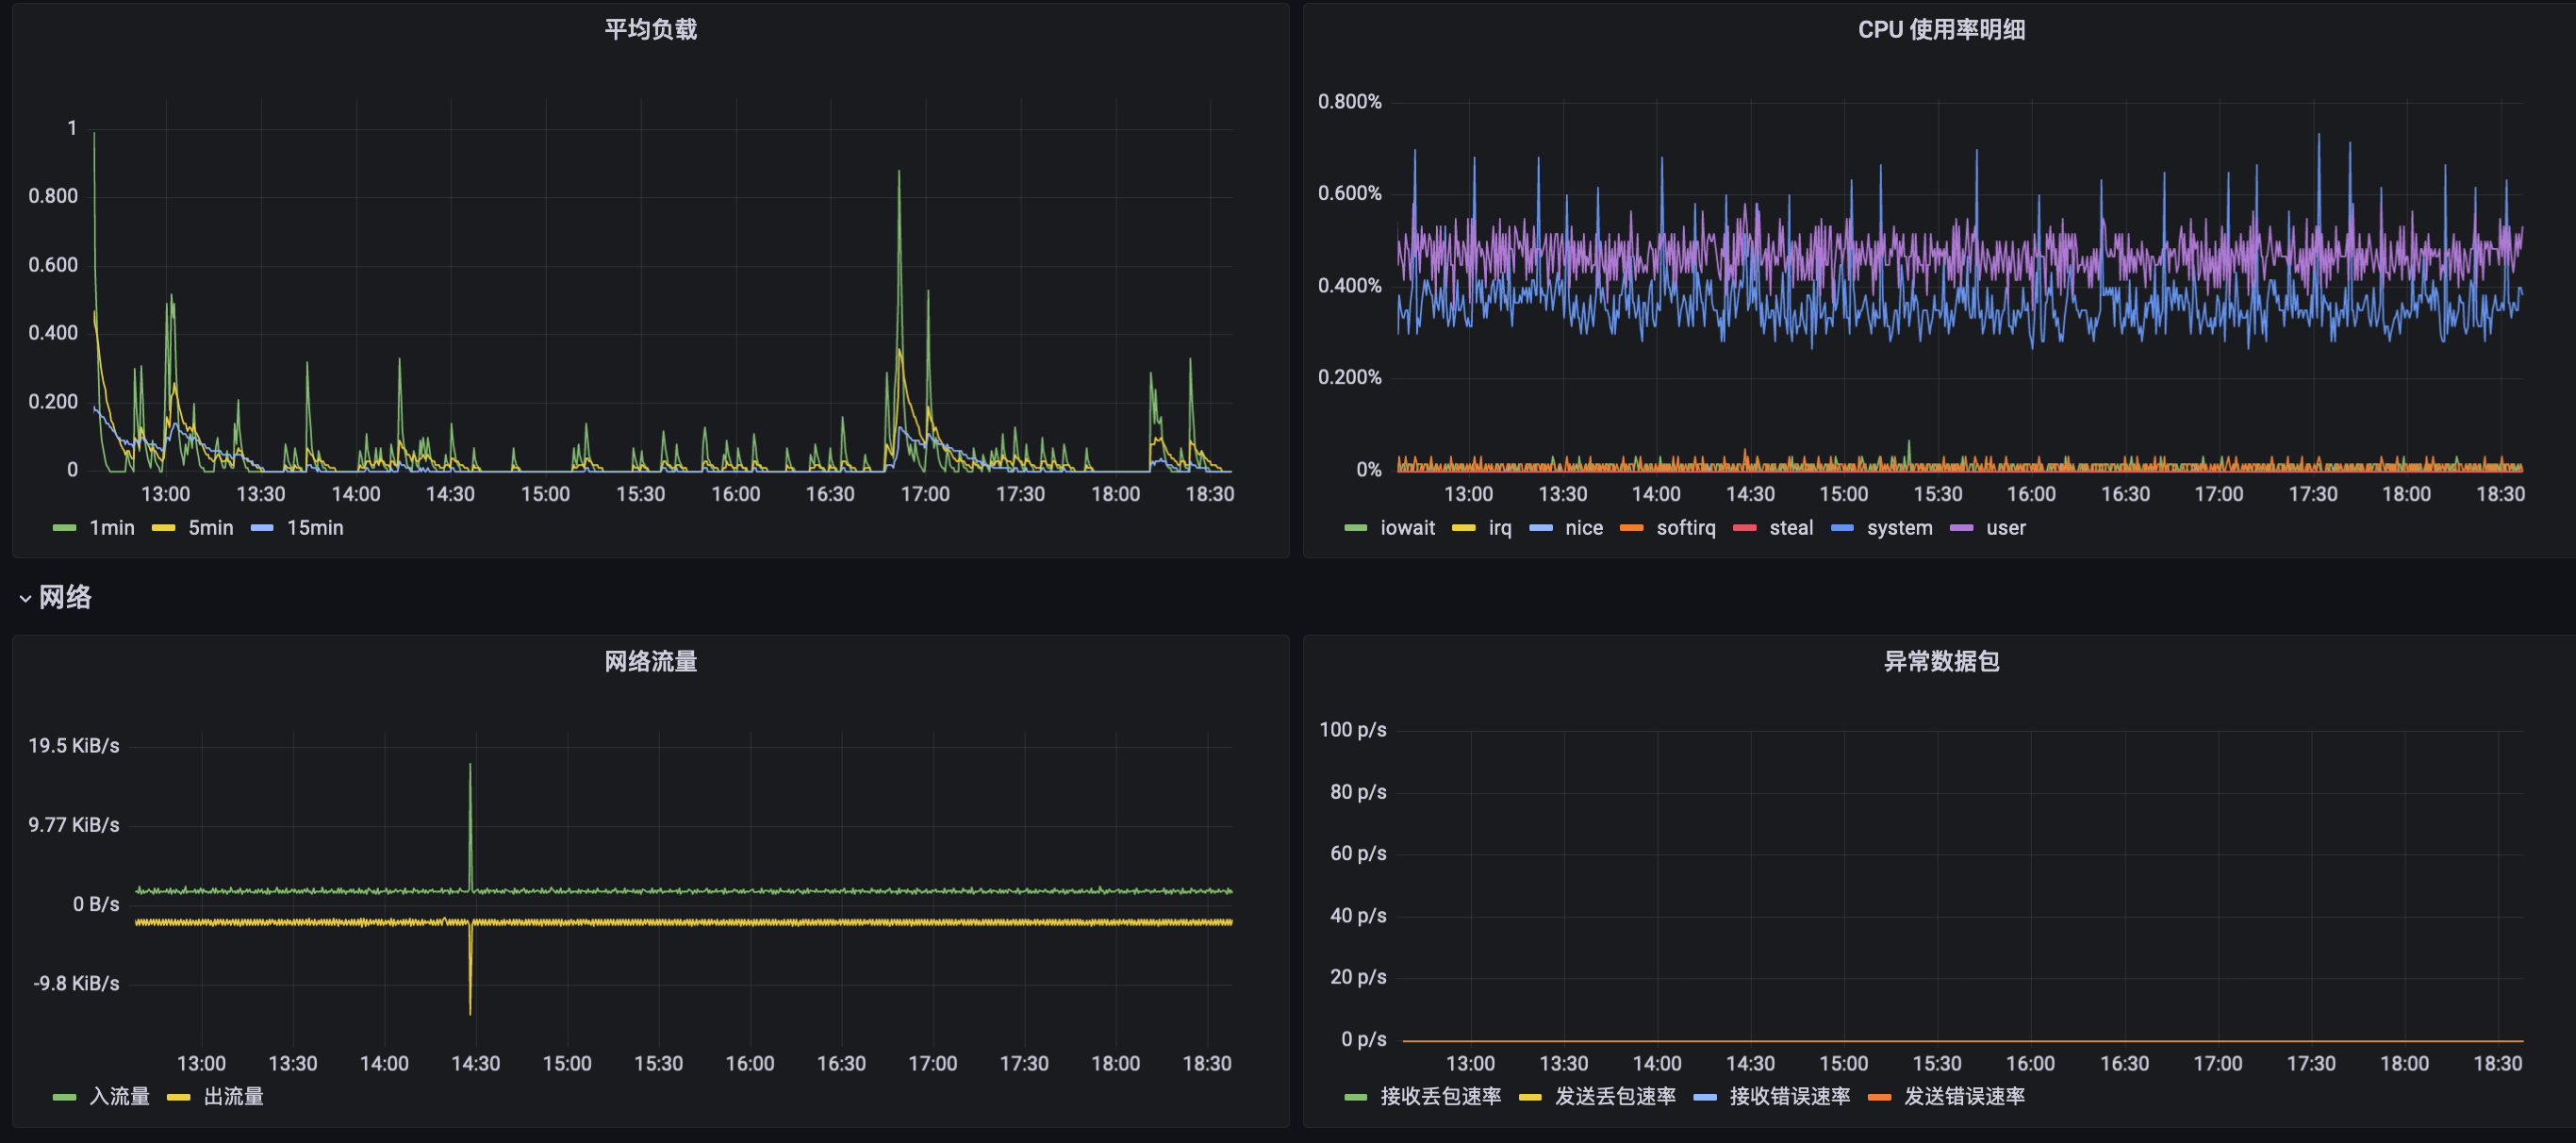
效果展示